User login
AMDEs in Children
Children with complex chronic conditions comprise an increasing proportion of hospital admissions, readmissions, and resource use.[1, 2, 3] Dependence on technology or medical devices is a frequent characteristic of children in this group.[4] Adverse medical device events (AMDEs) are estimated to occur in as many as 8% of all adult admissions, depending on the methods used to identify them.[5] These events may result in hospitalizations or complicate hospital stays. To date, however, the burden of AMDEs among hospitalized children is little described, even though children may be at increased risk for device events as compared to adults.[6] Although some medical devices are intended solely or primarily for use with children, most devices used with children have been initially developed for, tested with, and most frequently employed to treat adults.[6] Assessing the continued safety and effectiveness of medical devices marketed in the Unites States is the responsibility of the Center for Devices and Radiologic Health of the US Food and Drug Administration (FDA). Its existing mechanisms for postmarket device surveillance rely primarily on passive reporting systems and specific observational studies.[7]
The objective of this study was to utilize administrative data from children's hospitals to explore the prevalence and nature of AMDEs in tertiary care children's hospitals that treat significant numbers of children with complex needs requiring medical devices.
METHODS
Data were obtained from the Pediatric Health Information System (PHIS), an administrative database containing inpatient data from 44 not‐for‐profit, tertiary care, pediatric hospitals affiliated with the Children's Hospital Association. Data are deidentified at the time of submission, and are subjected to a number of reliability and validity checks.[8] Individual admission records have both a deidentified visit identification (ID) and patient ID, allowing for linkage of multiple admissions by the same patient.
AMDEs were defined by International Classification of Diseases, Ninth Revision (ICD‐9) codes, using a methodology developed by Samore et al., who identified a set of such codes that specified devices in their definitions and therefore were considered to have a high likelihood of indicating a device problem (see Supporting Information, Table S1, in the online version of this article).[5] The diagnosis codes were grouped into device categories (eg, nervous system, orthopedic, cardiac).
From the 44 hospitals, the primary study cohort consisted of any patient with an admission between January 1, 2004 and December 31, 2011 with 1 AMDE ICD‐9 code as a primary or secondary diagnosis.
Descriptive statistics for patient demographics and visit characteristics of AMDE admissions were generated and stratified by device category. We reported these as counts and percentages for categorical variables and as median and interquartile range for length of stay. We also reported on how frequently patients with AMDEs have a top 10 most common diagnosis and top 10 most common procedure during the AMDE admission. We also reported the presence or absence of a complex chronic condition.[9] We generated the list of most common principal diagnoses and procedures by a separate query of PHIS from 2004 to 2009. Our top 10 most common diagnoses included ICD‐9 codes 486 (pneumonia), 466.11 (acute bronchiolitis due to respiratory syncytial virus), V58.11 (chemotherapy encounter), 493.92 (asthma exacerbation), 493.91 (asthma with status asthmaticus), 466.19 (acute bronchiolitis due to other organism), 780.39 (other convulsions), 540.9 (acute appendicitis), 282.62 (sickle cell disease with crisis), and 276.51 (dehydration). Our top 10 most common procedures included ICD‐9 codes 38.93 (venous catheterization), 03.31 (spinal tap), 99.04 (packed blood cell transfusion), 99.15 (parenteral nutrition), 99.25 (cancer chemotherapy), 96.71 (invasive mechanical ventilation, <96 hours), 96.04 (endotracheal intubation), 96.72 (invasive mechanical ventilation,95 hours), 96.6 (enteral nutrition), and 99.05 (platelet transfusion). Analyses were performed using SAS Enterprise Guide version 4.2 for Windows (SAS Institute, Cary, NC).
This study was approved by Cincinnati Children's Hospital Medical Center Institutional Review Board.
RESULTS
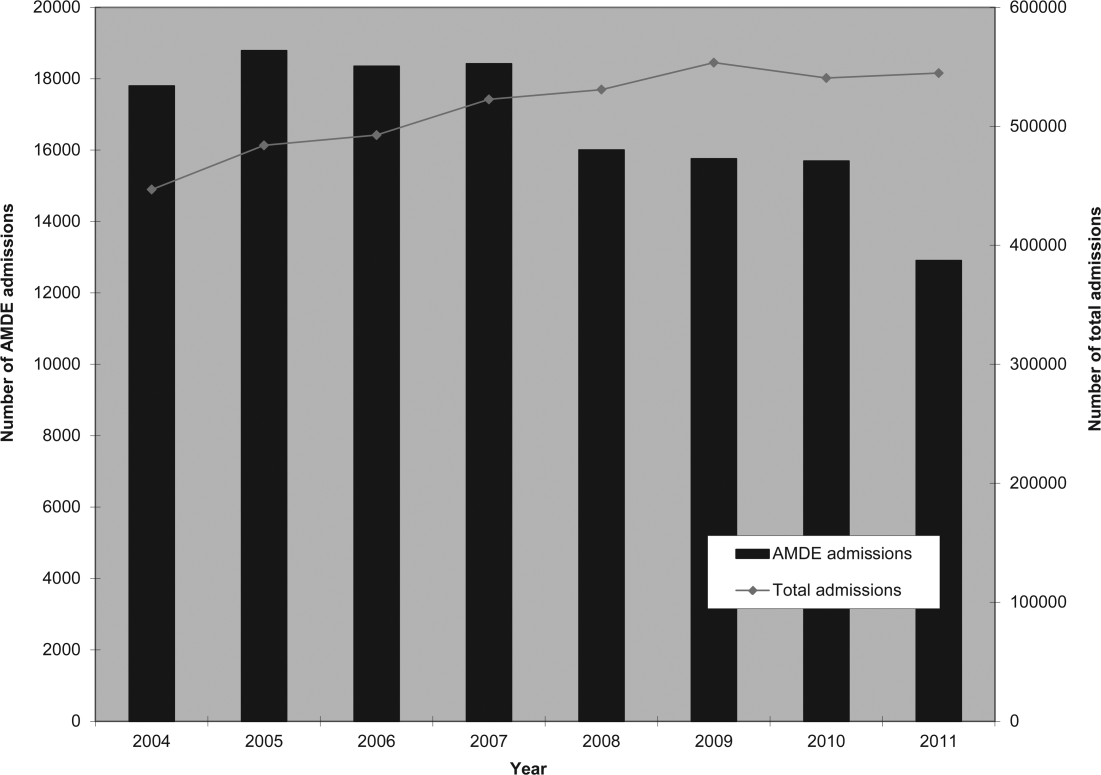
Of the 4,115,755 admissions during the study period, 136,465 (3.3%) had at least 1 AMDE. Over our study period, AMDEs were associated with a mean 17,058 inpatient stays annually. The number of AMDE‐related admissions decreased the last 4 years of our study period despite generally increasing admissions at PHIS hospitals (Figure 1). For 55% of the admissions (75,206/136,465), this AMDE code represented the primary diagnosis. Of these visits with a primary AMDE diagnosis, 39,874 (53%) were related to nervous system devices. The visits associated with AMDEs were comprised of 88,908 unique patients, 55% of whom were male (Table 1). The median age on admission was 6 years, and the interquartile range was 1 to 14 years of age.
| Total, N=88,908 | |
|---|---|
| Age at first admission | |
| 2 years | 35,160 (40.0%) |
| 35 years | 9,352 (10.5%) |
| 611 years | 16,148 (18.2%) |
| 1218 years | 22,483 (25.3%) |
| 19 years | 5,765 (6.5%) |
| Gender | |
| Male | 49,172 (55.3%) |
| Female | 39,730 (44.7%) |
| Race | |
| White | 59,842 (67.3%) |
| Black | 14,747 (16.6%) |
| Asian | 1,910 (2.2%) |
| American Indian | 900 (1.0%) |
| Other | 8,732 (9.8%) |
| Missing | 2,777 (3.1%) |
| Number of admissions by patient | |
| 1 | 66,814 (75.1%) |
| 2 | 12,520 (14.1%) |
| 3 | 4,504 (5.1%) |
| 4 | 5,071 (5.7%) |
Among admissions with AMDEs, 2.9% ended in death. The mortality was 0.5% when an AMDE was the primary diagnosis and 5.7% when the AMDE was a secondary diagnosis. The median length of inpatient stays was 6 days, with an interquartile range of 2 to 17 days.
Vascular access AMDEs were the most common event associated with admissions (26.6%), followed by nervous system devices (17.8%) (Table 2). The majority (75.5%) of patients admitted with AMDEs had a complex chronic condition. Less than half (46.8%) of AMDE admissions had an associated code for 1 of the 10 most common principal procedures. A minority (14.3%) of admissions had an associated ICD‐9 code for 1 of the top 10 most common principal diagnoses.
| Device Category | Admissions, n=136,465 | Presence of Top 10 Most Common Principal Procedures, n=63,801 | Presence of Top 10 Most Common Principal Diagnoses, n=19,472 | Presence of 1 Complex Chronic Condition, n=103,003 |
|---|---|---|---|---|
| ||||
| Only 1 AMDE diagnosis | ||||
| Vascular access | 36,257 (26.6%) | 26,658 (41.8%) | 6,518 (33.5%) | 26,022 (25.3%) |
| Nervous system | 24,243 (17.8%) | 4,266 (6.7%) | 3,567 (18.3%) | 21,516 (20.9%) |
| Unspecified device | 21,222 (15.6%) | 11,368 (17.8%) | 2,512 (12.9%) | 13,826 (13.4%) |
| Cardiac | 4,384 (3.2%) | 1,959 (3.1%) | 309 (1.6%) | 3,962 (3.8%) |
| Orthopedic | 3,064 (2.2%) | 874 (1.4%) | 179 (0.9%) | 1,235 (1.2%) |
| Dialysis | 2,426 (1.8%) | 836 (1.3%) | 281 (1.4%) | 1,462 (1.4%) |
| Genitourinary | 1,165 (0.9%) | 388 (0.6%) | 166 (0.9%) | 668 (0.6%) |
| Prosthetic cardiac valve | 518 (0.4%) | 236 (0.4%) | 33 (0.2%) | 411 (0.4%) |
| Urologic catheters | 379 (0.3%) | 228 (0.4%) | 93 (0.5%) | 223 (0.2%) |
| Defibrillator | 197 (0.1%) | 11 (0.02%) | 4 (0.02%) | 18 (0.02%) |
| Ocular | 3 (0.002%) | 1 (0.002%) | 1 (0.005%) | 1 (0.001%) |
| Only 1 AMDE diagnosis subtotal | 93,861 (68.8%) | 46,825 (73.4%) | 13,663 (70.2%) | 69,344 (67.3%) |
| 2 AMDE diagnoses | 39,557 (29.0%) | 15,003 (23.5%) | 5,312 (27.3%) | 31,091 (30.2%) |
| >2 AMDE diagnoses | 3,047 (2.2%) | 1,973 (3.1%) | 497 (2.6%) | 2,568 (2.5%) |
DISCUSSION
To our knowledge, our study is the first to report the burden of AMDEs among children requiring hospitalization. AMDEs are common in this population of children cared for at tertiary care children's hospitals, accounting for or complicating 3.3% of inpatient stays in these 44 hospitals. AMDEs were associated with a mean of >17,000 total visits per year. Vascular access devices and nervous system devices were the most common device categories linked to AMDEs. Similar to published literature, we found that the youngest children accounted for the highest proportion of AMDEs.[10, 11]
The majority (>75%) of children with an AMDE admission had diagnoses indicating complex chronic conditions during the admission. Over a partially overlapping study period, Feudtner and colleagues found 25.2% of patients admitted to PHIS hospitals had complex chronic conditions.[12] This finding, combined with the uncommon association of the most prevalent diagnoses and procedures, suggests that the burden of AMDEs falls disproportionately on this population of children. Death occurred considerably less commonly when AMDE diagnosis was the primary versus a secondary diagnosis (0.5% vs 5.7%). This finding likely illustrates 2 distinct populations: children with an AMDE that causes admission who have a relatively low risk of mortality and a second group who have AMDE‐complicated hospitalizations that may have an already high risk of mortality.
Our findings complement those of Wang and colleagues who employed the National Electronic Injury Surveillance System All Injury Program database to provide national estimates of medical device‐associated adverse events.[11] Importantly, this group used a different population (patients presenting to the emergency department) and a different methodology. These authors reported on device‐associated events, as they did not collect information to discriminate the device's role in the event. A walker that malfunctioned leading to patient injury would be a device‐related event; however, a patient who has a walker suffering a fall would be device‐associated, even if the walker's role in the injury was uncertain. We believe our methodology, established by Samore et al., more accurately identifies device‐related events.[5] Wang et al. found that 6.3% of pediatric patients who presented to emergency departments with medical device‐associated events were admitted to the hospital.[11] This resulted in national estimates of 9,082 events with 95% confidence intervals of 2,990 to 25,373 hospitalizations. Our findings of >17,000 AMDE‐related inpatient stays per annum included not only AMDEs leading to admissions but also those that were complications during stays.
Our study has several limitations, most related to the possibility of misclassification present in administrative data. Our approach only captured events that led to or complicated admissions. We suspect that ICD‐9 codes likely missed some AMDEs and that our estimates may therefore under‐represent this problem in our population. Future studies should compare our methodology, which has produced the first across‐center estimates of AMDE admissions, to alternative event capture techniques. We were unable to determine which events were present on admission and which complicated hospital stays, and it is likely that differing interventions would be required to reduce these 2 types of AMDEs. Another important limitation is that the PHIS database, comprised of data on children receiving care at tertiary academic medical centers with large numbers of pediatric subspecialists, is not representative of the population of children overall. The individual ICD‐9 codes for AMDEs are sufficiently nonspecific to limit the ability to characterize device events from administrative data alone. The high prevalence of unspecified device‐related admissions is an additional limitation. Although the estimates of these types of AMDEs are important in describing the frequency of these events, the unspecified category limits the ability to fully stratify based on device type and then implement monitoring strategies and interventions based on each.
To our knowledge, this study is the first multicenter analysis of the spectrum of pediatric AMDEs in hospitalized children. The AMDE prevalence is substantial, and the burden of these events largely falls on children with complex chronic conditions. Despite its limitations, this study complements recent efforts to enhance postmarket surveillance of pediatric devices including that of the FDA's Office of Pediatric Therapeutics, the recent FDA report Strengthening Our National System for Medical Device Postmarket Surveillance (
Our description of AMDEs by device category and patient characteristics is a first and necessary step to understanding the public health burden associated with device use in the pediatric population. Further developments in refined coding and device designation (eg, UDI systems) are needed to refine these estimates.
Acknowledgments
The authors thank Amy Liu, with the Data Management Center, and Colleen Mangeot, with the Biostatistical Consulting Unit in the Division of Epidemiology and Biostatistics, for their assistance with the data pull and creation of the analytic dataset. The authors also thank Lilliam Ambroggio, PhD, and Joshua Schaffzin, MD, PhD, for their thoughtful review of draft manuscripts.
Disclosures: Dr. Brady was supported by funds from the Bureau of Health Professions (BHPr), Health Resources and Services Administration (HRSA), and Department of Health and Human Services (DHHS) under grant T32 HP10027. This project was supported by cooperative agreement number U18 HS016957‐03 from the Agency for Healthcare Research and Quality. The content is solely the responsibility of the authors and does not necessarily represent the official views of the Agency for Healthcare Research and Quality. The study sponsors had no role in the study design; the collection, analysis, and interpretation of data; the writing of the report; or the decision to submit the article for publication. The opinions and assertions presented herein are the private views of the authors and are not to be construed as conveying either an official endorsement or criticism by the US Department of Health and Human Services, The Public Health Service, or the US Food and Drug Administration.
- , , , et al. Hospital utilization and characteristics of patients experiencing recurrent readmissions within children's hospitals. JAMA. 2011;305(7):682–690.
- , , , et al. Children with complex chronic conditions in inpatient hospital settings in the United States. Pediatrics. 2010;126(4):647–655.
- , , , , , . Increasing prevalence of medically complex children in US hospitals. Pediatrics. 2010;126(4):638–646.
- , , , et al. Children with medical complexity: an emerging population for clinical and research initiatives. Pediatrics. 2011;127(3):529–538.
- , , , et al. Surveillance of medical device‐related hazards and adverse events in hospitalized patients. JAMA. 2004;291(3):325–334.
- Institute of Medicine (U.S.). Committee on Postmarket Surveillance of Pediatric Medical Devices. , . Safe medical devices for children. Washington, DC: National Academies Press; 2006.
- , . Pharmacovigilance. 2nd ed. Chichester, England ; Hoboken, NJ: John Wiley 2007.
- , , , . Corticosteroids and mortality in children with bacterial meningitis. JAMA. 2008;299(17):2048–2055.
- , , . Pediatric deaths attributable to complex chronic conditions: a population‐based study of Washington State, 1980–1997. Pediatrics. 2000;106(1 pt 2):205–209.
- , , , et al. Infection rates following initial cerebrospinal fluid shunt placement across pediatric hospitals in the United States. Clinical article. J Neurosurg Pediatr. 2009;4(2):156–165.
- , , , et al. Emergency department visits for medical device‐associated adverse events among children. Pediatrics. 2010;126(2):247–259.
- , , , et al. How well can hospital readmission be predicted in a cohort of hospitalized children? A retrospective, multicenter study. Pediatrics. 2009;123(1):286–293.
- , . Unique device identification in the service of public health. N Engl J Med. 2012;367(17):1583–1585.
Children with complex chronic conditions comprise an increasing proportion of hospital admissions, readmissions, and resource use.[1, 2, 3] Dependence on technology or medical devices is a frequent characteristic of children in this group.[4] Adverse medical device events (AMDEs) are estimated to occur in as many as 8% of all adult admissions, depending on the methods used to identify them.[5] These events may result in hospitalizations or complicate hospital stays. To date, however, the burden of AMDEs among hospitalized children is little described, even though children may be at increased risk for device events as compared to adults.[6] Although some medical devices are intended solely or primarily for use with children, most devices used with children have been initially developed for, tested with, and most frequently employed to treat adults.[6] Assessing the continued safety and effectiveness of medical devices marketed in the Unites States is the responsibility of the Center for Devices and Radiologic Health of the US Food and Drug Administration (FDA). Its existing mechanisms for postmarket device surveillance rely primarily on passive reporting systems and specific observational studies.[7]
The objective of this study was to utilize administrative data from children's hospitals to explore the prevalence and nature of AMDEs in tertiary care children's hospitals that treat significant numbers of children with complex needs requiring medical devices.
METHODS
Data were obtained from the Pediatric Health Information System (PHIS), an administrative database containing inpatient data from 44 not‐for‐profit, tertiary care, pediatric hospitals affiliated with the Children's Hospital Association. Data are deidentified at the time of submission, and are subjected to a number of reliability and validity checks.[8] Individual admission records have both a deidentified visit identification (ID) and patient ID, allowing for linkage of multiple admissions by the same patient.
AMDEs were defined by International Classification of Diseases, Ninth Revision (ICD‐9) codes, using a methodology developed by Samore et al., who identified a set of such codes that specified devices in their definitions and therefore were considered to have a high likelihood of indicating a device problem (see Supporting Information, Table S1, in the online version of this article).[5] The diagnosis codes were grouped into device categories (eg, nervous system, orthopedic, cardiac).
From the 44 hospitals, the primary study cohort consisted of any patient with an admission between January 1, 2004 and December 31, 2011 with 1 AMDE ICD‐9 code as a primary or secondary diagnosis.
Descriptive statistics for patient demographics and visit characteristics of AMDE admissions were generated and stratified by device category. We reported these as counts and percentages for categorical variables and as median and interquartile range for length of stay. We also reported on how frequently patients with AMDEs have a top 10 most common diagnosis and top 10 most common procedure during the AMDE admission. We also reported the presence or absence of a complex chronic condition.[9] We generated the list of most common principal diagnoses and procedures by a separate query of PHIS from 2004 to 2009. Our top 10 most common diagnoses included ICD‐9 codes 486 (pneumonia), 466.11 (acute bronchiolitis due to respiratory syncytial virus), V58.11 (chemotherapy encounter), 493.92 (asthma exacerbation), 493.91 (asthma with status asthmaticus), 466.19 (acute bronchiolitis due to other organism), 780.39 (other convulsions), 540.9 (acute appendicitis), 282.62 (sickle cell disease with crisis), and 276.51 (dehydration). Our top 10 most common procedures included ICD‐9 codes 38.93 (venous catheterization), 03.31 (spinal tap), 99.04 (packed blood cell transfusion), 99.15 (parenteral nutrition), 99.25 (cancer chemotherapy), 96.71 (invasive mechanical ventilation, <96 hours), 96.04 (endotracheal intubation), 96.72 (invasive mechanical ventilation,95 hours), 96.6 (enteral nutrition), and 99.05 (platelet transfusion). Analyses were performed using SAS Enterprise Guide version 4.2 for Windows (SAS Institute, Cary, NC).
This study was approved by Cincinnati Children's Hospital Medical Center Institutional Review Board.
RESULTS
Of the 4,115,755 admissions during the study period, 136,465 (3.3%) had at least 1 AMDE. Over our study period, AMDEs were associated with a mean 17,058 inpatient stays annually. The number of AMDE‐related admissions decreased the last 4 years of our study period despite generally increasing admissions at PHIS hospitals (Figure 1). For 55% of the admissions (75,206/136,465), this AMDE code represented the primary diagnosis. Of these visits with a primary AMDE diagnosis, 39,874 (53%) were related to nervous system devices. The visits associated with AMDEs were comprised of 88,908 unique patients, 55% of whom were male (Table 1). The median age on admission was 6 years, and the interquartile range was 1 to 14 years of age.
| Total, N=88,908 | |
|---|---|
| Age at first admission | |
| 2 years | 35,160 (40.0%) |
| 35 years | 9,352 (10.5%) |
| 611 years | 16,148 (18.2%) |
| 1218 years | 22,483 (25.3%) |
| 19 years | 5,765 (6.5%) |
| Gender | |
| Male | 49,172 (55.3%) |
| Female | 39,730 (44.7%) |
| Race | |
| White | 59,842 (67.3%) |
| Black | 14,747 (16.6%) |
| Asian | 1,910 (2.2%) |
| American Indian | 900 (1.0%) |
| Other | 8,732 (9.8%) |
| Missing | 2,777 (3.1%) |
| Number of admissions by patient | |
| 1 | 66,814 (75.1%) |
| 2 | 12,520 (14.1%) |
| 3 | 4,504 (5.1%) |
| 4 | 5,071 (5.7%) |
Among admissions with AMDEs, 2.9% ended in death. The mortality was 0.5% when an AMDE was the primary diagnosis and 5.7% when the AMDE was a secondary diagnosis. The median length of inpatient stays was 6 days, with an interquartile range of 2 to 17 days.
Vascular access AMDEs were the most common event associated with admissions (26.6%), followed by nervous system devices (17.8%) (Table 2). The majority (75.5%) of patients admitted with AMDEs had a complex chronic condition. Less than half (46.8%) of AMDE admissions had an associated code for 1 of the 10 most common principal procedures. A minority (14.3%) of admissions had an associated ICD‐9 code for 1 of the top 10 most common principal diagnoses.
| Device Category | Admissions, n=136,465 | Presence of Top 10 Most Common Principal Procedures, n=63,801 | Presence of Top 10 Most Common Principal Diagnoses, n=19,472 | Presence of 1 Complex Chronic Condition, n=103,003 |
|---|---|---|---|---|
| ||||
| Only 1 AMDE diagnosis | ||||
| Vascular access | 36,257 (26.6%) | 26,658 (41.8%) | 6,518 (33.5%) | 26,022 (25.3%) |
| Nervous system | 24,243 (17.8%) | 4,266 (6.7%) | 3,567 (18.3%) | 21,516 (20.9%) |
| Unspecified device | 21,222 (15.6%) | 11,368 (17.8%) | 2,512 (12.9%) | 13,826 (13.4%) |
| Cardiac | 4,384 (3.2%) | 1,959 (3.1%) | 309 (1.6%) | 3,962 (3.8%) |
| Orthopedic | 3,064 (2.2%) | 874 (1.4%) | 179 (0.9%) | 1,235 (1.2%) |
| Dialysis | 2,426 (1.8%) | 836 (1.3%) | 281 (1.4%) | 1,462 (1.4%) |
| Genitourinary | 1,165 (0.9%) | 388 (0.6%) | 166 (0.9%) | 668 (0.6%) |
| Prosthetic cardiac valve | 518 (0.4%) | 236 (0.4%) | 33 (0.2%) | 411 (0.4%) |
| Urologic catheters | 379 (0.3%) | 228 (0.4%) | 93 (0.5%) | 223 (0.2%) |
| Defibrillator | 197 (0.1%) | 11 (0.02%) | 4 (0.02%) | 18 (0.02%) |
| Ocular | 3 (0.002%) | 1 (0.002%) | 1 (0.005%) | 1 (0.001%) |
| Only 1 AMDE diagnosis subtotal | 93,861 (68.8%) | 46,825 (73.4%) | 13,663 (70.2%) | 69,344 (67.3%) |
| 2 AMDE diagnoses | 39,557 (29.0%) | 15,003 (23.5%) | 5,312 (27.3%) | 31,091 (30.2%) |
| >2 AMDE diagnoses | 3,047 (2.2%) | 1,973 (3.1%) | 497 (2.6%) | 2,568 (2.5%) |
DISCUSSION
To our knowledge, our study is the first to report the burden of AMDEs among children requiring hospitalization. AMDEs are common in this population of children cared for at tertiary care children's hospitals, accounting for or complicating 3.3% of inpatient stays in these 44 hospitals. AMDEs were associated with a mean of >17,000 total visits per year. Vascular access devices and nervous system devices were the most common device categories linked to AMDEs. Similar to published literature, we found that the youngest children accounted for the highest proportion of AMDEs.[10, 11]
The majority (>75%) of children with an AMDE admission had diagnoses indicating complex chronic conditions during the admission. Over a partially overlapping study period, Feudtner and colleagues found 25.2% of patients admitted to PHIS hospitals had complex chronic conditions.[12] This finding, combined with the uncommon association of the most prevalent diagnoses and procedures, suggests that the burden of AMDEs falls disproportionately on this population of children. Death occurred considerably less commonly when AMDE diagnosis was the primary versus a secondary diagnosis (0.5% vs 5.7%). This finding likely illustrates 2 distinct populations: children with an AMDE that causes admission who have a relatively low risk of mortality and a second group who have AMDE‐complicated hospitalizations that may have an already high risk of mortality.
Our findings complement those of Wang and colleagues who employed the National Electronic Injury Surveillance System All Injury Program database to provide national estimates of medical device‐associated adverse events.[11] Importantly, this group used a different population (patients presenting to the emergency department) and a different methodology. These authors reported on device‐associated events, as they did not collect information to discriminate the device's role in the event. A walker that malfunctioned leading to patient injury would be a device‐related event; however, a patient who has a walker suffering a fall would be device‐associated, even if the walker's role in the injury was uncertain. We believe our methodology, established by Samore et al., more accurately identifies device‐related events.[5] Wang et al. found that 6.3% of pediatric patients who presented to emergency departments with medical device‐associated events were admitted to the hospital.[11] This resulted in national estimates of 9,082 events with 95% confidence intervals of 2,990 to 25,373 hospitalizations. Our findings of >17,000 AMDE‐related inpatient stays per annum included not only AMDEs leading to admissions but also those that were complications during stays.
Our study has several limitations, most related to the possibility of misclassification present in administrative data. Our approach only captured events that led to or complicated admissions. We suspect that ICD‐9 codes likely missed some AMDEs and that our estimates may therefore under‐represent this problem in our population. Future studies should compare our methodology, which has produced the first across‐center estimates of AMDE admissions, to alternative event capture techniques. We were unable to determine which events were present on admission and which complicated hospital stays, and it is likely that differing interventions would be required to reduce these 2 types of AMDEs. Another important limitation is that the PHIS database, comprised of data on children receiving care at tertiary academic medical centers with large numbers of pediatric subspecialists, is not representative of the population of children overall. The individual ICD‐9 codes for AMDEs are sufficiently nonspecific to limit the ability to characterize device events from administrative data alone. The high prevalence of unspecified device‐related admissions is an additional limitation. Although the estimates of these types of AMDEs are important in describing the frequency of these events, the unspecified category limits the ability to fully stratify based on device type and then implement monitoring strategies and interventions based on each.
To our knowledge, this study is the first multicenter analysis of the spectrum of pediatric AMDEs in hospitalized children. The AMDE prevalence is substantial, and the burden of these events largely falls on children with complex chronic conditions. Despite its limitations, this study complements recent efforts to enhance postmarket surveillance of pediatric devices including that of the FDA's Office of Pediatric Therapeutics, the recent FDA report Strengthening Our National System for Medical Device Postmarket Surveillance (
Our description of AMDEs by device category and patient characteristics is a first and necessary step to understanding the public health burden associated with device use in the pediatric population. Further developments in refined coding and device designation (eg, UDI systems) are needed to refine these estimates.
Acknowledgments
The authors thank Amy Liu, with the Data Management Center, and Colleen Mangeot, with the Biostatistical Consulting Unit in the Division of Epidemiology and Biostatistics, for their assistance with the data pull and creation of the analytic dataset. The authors also thank Lilliam Ambroggio, PhD, and Joshua Schaffzin, MD, PhD, for their thoughtful review of draft manuscripts.
Disclosures: Dr. Brady was supported by funds from the Bureau of Health Professions (BHPr), Health Resources and Services Administration (HRSA), and Department of Health and Human Services (DHHS) under grant T32 HP10027. This project was supported by cooperative agreement number U18 HS016957‐03 from the Agency for Healthcare Research and Quality. The content is solely the responsibility of the authors and does not necessarily represent the official views of the Agency for Healthcare Research and Quality. The study sponsors had no role in the study design; the collection, analysis, and interpretation of data; the writing of the report; or the decision to submit the article for publication. The opinions and assertions presented herein are the private views of the authors and are not to be construed as conveying either an official endorsement or criticism by the US Department of Health and Human Services, The Public Health Service, or the US Food and Drug Administration.
- , , , et al. Hospital utilization and characteristics of patients experiencing recurrent readmissions within children's hospitals. JAMA. 2011;305(7):682–690.
- , , , et al. Children with complex chronic conditions in inpatient hospital settings in the United States. Pediatrics. 2010;126(4):647–655.
- , , , , , . Increasing prevalence of medically complex children in US hospitals. Pediatrics. 2010;126(4):638–646.
- , , , et al. Children with medical complexity: an emerging population for clinical and research initiatives. Pediatrics. 2011;127(3):529–538.
- , , , et al. Surveillance of medical device‐related hazards and adverse events in hospitalized patients. JAMA. 2004;291(3):325–334.
- Institute of Medicine (U.S.). Committee on Postmarket Surveillance of Pediatric Medical Devices. , . Safe medical devices for children. Washington, DC: National Academies Press; 2006.
- , . Pharmacovigilance. 2nd ed. Chichester, England ; Hoboken, NJ: John Wiley 2007.
- , , , . Corticosteroids and mortality in children with bacterial meningitis. JAMA. 2008;299(17):2048–2055.
- , , . Pediatric deaths attributable to complex chronic conditions: a population‐based study of Washington State, 1980–1997. Pediatrics. 2000;106(1 pt 2):205–209.
- , , , et al. Infection rates following initial cerebrospinal fluid shunt placement across pediatric hospitals in the United States. Clinical article. J Neurosurg Pediatr. 2009;4(2):156–165.
- , , , et al. Emergency department visits for medical device‐associated adverse events among children. Pediatrics. 2010;126(2):247–259.
- , , , et al. How well can hospital readmission be predicted in a cohort of hospitalized children? A retrospective, multicenter study. Pediatrics. 2009;123(1):286–293.
- , . Unique device identification in the service of public health. N Engl J Med. 2012;367(17):1583–1585.
