User login
Evaluating suspected pulmonary hypertension: A structured approach
Pulmonary arterial hypertension (PAH) is a hemodynamic disorder that affects small and medium-size pulmonary arteries through cellular proliferation and luminal narrowing.1 Increased pulmonary vascular resistance causes restricted blood flow in these arteries, leading to elevated pulmonary arterial pressure and afterload on the right ventricle. Despite advances in therapy, death usually occurs as a result of right ventricular failure.

- Group 1—PAH, due to narrowed pulmonary arteries
- Group 2—due to left heart disease
- Group 3—due to lung disease or hypoxia, or both
- Group 4—due to chronic thromboembolism or other pulmonary artery obstruction
- Group 5—due to uncertain or multifactorial causes.
Experts recognize the morbidity and mortality associated with pulmonary hypertension now more than in the past, and they emphasize recognizing it early. Guidelines for its diagnosis and treatment were updated in 2015.1
Below, we use a case to discuss recommendations for initial evaluation and classification of pulmonary hypertension, particularly PAH.
A PATIENT SUSPECTED OF HAVING PULMONARY HYPERTENSION
A 63-year-old woman with a 25-pack-year history of tobacco use, as well as pulmonary embolism and coronary artery disease, presents to her primary care physician with exertional dyspnea. She had been a clerk at a hardware store and physically active until she took early retirement 8 months ago because of increasing fatigue. She initially felt the fatigue was simply “a sign of getting old.”
Since retiring, she has noticed the slow onset of progressive dyspnea on exertion. She can no longer climb more than 1 flight of stairs or walk more than 1 block. She also complains of mild, fluctuating edema in her lower extremities over the past month. She quit smoking 8 years ago after undergoing placement of a drug-eluting stent in the mid-left circumflex artery. After this, she received clopidogrel and was followed by a cardiologist for 2 years but stopped taking the medication because of bruising. She has not seen her cardiologist in more than 5 years.
She underwent elective right total knee arthroplasty 3 years ago, complicated by acute deep vein thrombosis in the right common femoral vein. Computed tomography (CT) at that time did not reveal pulmonary emboli. She received warfarin therapy for 3 months.
She reports no current cough, chest pain, lightheadedness, or syncope. She has no orthopnea, and she feels normal at rest.
Her family history is unremarkable, and she has had no exposure to illicit substances, environmental toxins, or dietary supplements. She takes aspirin 81 mg daily, metoprolol 25 mg twice daily, lisinopril 10 mg daily, and simvastatin 40 mg at bedtime.
Her primary care physician detects a murmur in the left lower sternal border and sends her for transthoracic echocardiography, which demonstrates mild right ventricular dilation, right atrial dilation, and mildly reduced right ventricular function. The calculated right ventricular systolic pressure is 69 mm Hg. The left ventricle shows mild concentric hypertrophy; the left atrium is normal in size.
DIAGNOSTIC EVALUATION OF SUSPECTED PULMONARY HYPERTENSION

CLINICAL MANIFESTATIONS

Symptoms and signs. As in the patient described above, the first symptoms such as exertional dyspnea, fatigue, and lightheadedness usually arise in situations that call for increased cardiac output.4 As right ventricular function worsens, symptoms start to occur at rest, and signs of increased right ventricular preload appear, such as abdominal and lower-extremity edema and pericardial effusion. Syncope is a sign of severe right ventricular dysfunction.5
Physical examination. Look for signs of increased right ventricular loading and failure, eg:
- An accentuated intensity and persistent splitting of the second heart sound
- A prominent parasternal heave
- A prominent jugular “a” wave
- A systolic murmur along the left sternal border at the fourth intercostal space, which may worsen with breath-holding
- Pitting lower-extremity edema
- Hepatomegaly
- Hepatojugular reflux
- Hepatic pulsatility.6
ECHOCARDIOGRAPHY IN SUSPECTED PULMONARY HYPERTENSION

Many practitioners rely heavily on the estimated right ventricular systolic pressure in diagnosing pulmonary hypertension. In theory, this number should be nearly the same as the pulmonary arterial systolic pressure. However, technical and patient-related aspects of transthoracic echocardiography often limit accurate measurement of the right ventricular systolic pressure, and readings often differ from those measured with right heart catheterization.8

Our patient had a markedly elevated right ventricular systolic pressure and signs of right ventricular dysfunction, suggesting a high probability of pulmonary hypertension.
EVALUATING LEFT HEART DISEASE (WHO GROUP 2)
More than 75% of cases of pulmonary hypertension are directly related to left ventricular dysfunction or mitral or aortic valve disease (WHO group 2).1 Since group 2 differs markedly from group 1 (PAH) in its pathophysiology and treatment, it is important to distinguish between them.
Compared with WHO group 1 patients, those in group 2 tend to be older, more of them are male, and more of them have comorbidities such as metabolic syndrome, hypertension, and coronary artery disease.1,9 A combination of risk factors and clinical findings should be considered in identifying these patients.10
Transthoracic echocardiography is used to detect features of systolic and diastolic dysfunction. Left atrial enlargement is a clue that left heart disease may be present. In addition, signs of left ventricular or valvular dysfunction on electrocardiography or chest radiography are often helpful.
When estimated right ventricular systolic pressures are only minimally abnormal and no significant right ventricular dysfunction exists, further diagnostic evaluation is not warranted. However, because no single identifying feature or variable can readily distinguish group 2 from the other WHO groups, further evaluation should be considered if the right ventricular systolic pressure is significantly elevated or right ventricular dysfunction exists.
Our patient had several risk factors for left heart disease, including a history of smoking and coronary artery disease. Nonetheless, findings consistent with severe right ventricular dysfunction necessitated further evaluation for other possible causes of her suspected pulmonary hypertension.
Postcapillary pulmonary hypertension
In patients for whom further evaluation is pursued, the diagnosis of WHO group 2 pulmonary hypertension is ultimately based on findings consistent with postcapillary or “passive” pulmonary hypertension on right heart catheterization. Although mean pulmonary arterial pressures must be at least 25 mm Hg to certify the diagnosis of pulmonary hypertension, a pulmonary artery occlusion pressure greater than 15 mm Hg (normal 6–12) and pulmonary vascular resistance of 3 Wood units or less (normal 0.3–1.6) suggests the pulmonary hypertension is due to elevated left atrial pressure (ie, postcapillary) rather than precapillary pulmonary arterial remodeling.
Mixed pre- and postcapillary pulmonary hypertension
Distinguishing pulmonary venous hypertension from PAH is important, since their management differs. In particular, PAH-specific therapies (ie, prostacyclin analogues, prostaglandin I2 receptor agonists, endothelin receptor antagonists, phosphodiesterase-5 inhibitors, and cyclic guanosine monophosphate stimulators) can have a detrimental effect in WHO group 2 patients by causing increased pulmonary capillary leakage with pulmonary edema.11,12
In some patients, chronic passive congestion in the pulmonary venous circulation causes additional disruption of the homeostatic milieu regulating precapillary smooth muscle and endothelial function. These changes result in structural remodeling of precapillary arterioles and increased precapillary vascular resistance, creating a “mixed” pulmonary hypertension with both pre- and postcapillary abnormalities.
There is controversy over the ideal way to identify these patients but little disagreement that they face a worse prognosis than those without precapillary remodeling.13 In light of this, efforts have been made to characterize this cohort.
Historically, mixed pre- and postcapillary pulmonary hypertension was defined as the combination of all of the following:
- Mean pulmonary arterial pressure ≥ 25 mm Hg
- Pulmonary artery occlusion pressure > 15 mm Hg
- Transpulmonary gradient (the mean pulmonary arterial pressure minus the pulmonary artery occlusion pressure) > 12 mm Hg.14
However, the utility of the transpulmonary gradient for distinguishing mixed pulmonary hypertension has been questioned because of concerns over its susceptibility to variations in stroke volume and loading conditions.15
The diastolic pulmonary gradient (the pulmonary arterial diastolic pressure minus the pulmonary artery occlusion pressure) has been proposed as an alternative to the transpulmonary gradient under the theory that it is less sensitive to fluctuation from variations in flow or loading.15
Current guidelines1 suggest that a patient who has all of the following should be considered to have mixed pulmonary hypertension:
- A mean pulmonary arterial pressure > 25 mm Hg
- A pulmonary artery occlusion pressure > 15 mm Hg
- A diastolic pulmonary gradient > 7 mm Hg or a pulmonary vascular resistance > 3 Wood units, or both.
Occult group 2 pulmonary hypertension
Currently, the diagnosis of WHO group 2 pulmonary hypertension is based on elevated resting pulmonary artery occlusion pressure. However, some patients with WHO group 2 pulmonary hypertension and transiently low preload from aggressive diuresis or fasting may have a low pulmonary artery occlusion pressure during right heart catheterization and be misdiagnosed as having WHO group 1 PAH.12,16
This concern was acknowledged in the 2015 Ambrisentan and Tadalafil in Patients With Pulmonary Arterial Hypertension (AMBITION) study after investigators changed the protocol to exclude patients who technically met the criteria for WHO group 1 PAH, but had borderline-elevated pulmonary artery occlusion pressure and additional risk factors worrisome for left heart disease and occult WHO group 2 pulmonary hypertension.17,18
Several strategies, including passive leg-raising, fluid challenge, and exercise during diagnostic right heart catheterization, have been proposed to better classify these patients.19 Unfortunately, due to a lack of standardization of normal values and methodology for executing these maneuvers, consensus is lacking over their routine use, and recommendations for their use have not been provided.1
EVALUATION OF LUNG DISEASE (WHO GROUP 3)
All patients with suspected pulmonary hypertension should also be assessed for underlying pulmonary parenchymal or physiologic disease.
WHO group 3 consists of pulmonary disorders that, over an extended time, can lead to pulmonary hypertension. The most common of these disorders include chronic obstructive pulmonary disease, interstitial lung disease, and combined pulmonary fibrosis and emphysema.1
Pulmonary hypertension in these patients is precapillary, and changes in pulmonary vascular resistance are influenced by multiple factors, the most significant of which is alveolar hypoxia. Hypoxia induces pulmonary artery vasoconstrictionn (in contrast to the reflexive hemodynamics seen in peripheral tissues, where systemic vascular tone is generally lower in states of hypoxia) as a mechanism to divert pulmonary blood flow to well-ventilated portions of the lung and maintain ventilation-perfusion matching.
Repeated chronic hypoxia also alters cellular structure and function of pulmonary vessels and leads to medial hypertrophy and increased vascular tone, thus contributing to the development of pulmonary hypertension in many of these patients.20
Obstructive sleep apnea. Up to 70% of patients with obstructive sleep apnea have pulmonary hypertension.21 Chronic repetitive hypoxia throughout the night increases the levels of reactive oxygen species and alters cellular and molecular signaling, thus inducing vascular remodeling. In addition, apneic events during sleep promote catecholamine-driven elevations in systemic blood pressure. Over time, patients are at higher risk of developing left ventricular dysfunction and concomitant postcapillary group 2 pulmonary hypertension.22 Because typical methods of obstructive sleep apnea screening (eg, the Epworth Sleep Scale) have been historically poor at discriminating PAH patients with obstructive sleep apnea from those without, patients diagnosed with PAH should be considered for formal sleep testing.23,24
Pulmonary function tests, chest imaging
Pulmonary function tests and high-resolution computed tomography are essential to any PAH evaluation and help to exclude WHO group 3 pulmonary hypertension.1
An abnormal result on CT or spirometry can help point toward parenchymal lung disease. Normal spirometry and lung volumes with an isolated reduction in the diffusing capacity of the lung for carbon monoxide (Dlco) is typical of patients with WHO group 1 PAH.

In our patient, CT of the chest did not show any evidence of parenchymal lung disease, and pulmonary function tests showed no evidence of obstruction or restriction. There was a moderate decrease in Dlco, which did not reach normal limits when adjusted for lung volumes. In this setting, further evaluation of her PAH was warranted.
EVALUATION OF THROMBOEMBOLIC DISEASE (WHO GROUP 4)
Once pulmonary hypertension due to underlying left heart disease or parenchymal lung disease has been excluded, testing for chronic thromboembolic pulmonary hypertension is necessary, even in the absence of prior known pulmonary embolism. Identifying these patients is paramount, as chronic thromboembolic pulmonary hypertension (WHO group 4) is the only type of pulmonary hypertension for which a definitive cure is available.26
Up to 9% of patients who survive acute pulmonary embolism exhibit features of chronic proximal thrombosis and remodeling of distal pulmonary arteries.27
It remains unknown exactly why some patients develop chronic thromboembolic pulmonary hypertension and others do not, but the pathophysiology involves inappropriate thrombus resolution after venous thromboembolic events. Monocyte recruitment (which plays an important role in thrombus resolution) is reduced, angiogenesis is impaired (preventing effective vascular collateralization), and abnormal fibroblast proliferation leads to distal pulmonary vascular wall thickening.28 There is some evidence of increased thrombophilic risk in this population, and approximately 10% to 20% of patients are positive for antiphospholipid antibodies or lupus anticoagulant.29,30
Patients with chronic thromboembolic pulmonary hypertension usually present with symptoms similar to those of WHO group 1 PAH. Up to one-quarter of patients have no recollection of prior pulmonary embolism.31 As the disease progresses, signs and symptoms related to elevated pulmonary vascular resistance and right ventricular dysfunction are common.32,33
Although thrombi usually resolve quickly, the diagnosis of chronic thromboembolic pulmonary hypertension should be made only after at least 3 months of appropriate anticoagulation to avoid treatment of transient hemodynamic changes often seen after an acute pulmonary embolism.1
Radiographic changes associated with chronic thromboembolic pulmonary hypertension are distinct from the intraluminal filling defects seen with acute thromboembolism, since chronic thrombi tend to become organized and eccentric. On imaging, one may see features of rapid luminal narrowing or eccentric filling defects rather than the conventional central filling defects of acute pulmonary embolism. These changes are often overlooked by radiologists who are not specifically looking for chronic thromboembolic pulmonary hypertension.34 For this reason, the sensitivity and specificity of identifying chronic thromboembolic disease using radionuclide ventilation-perfusion lung scanning is superior to that of CT angiography.
All patients with suspected PAH should undergo a ventilation-perfusion scan.1,35 In patients with ventilation-perfusion mismatch on radionuclide scanning, pulmonary angiography can fulfill multiple goals of measuring pulmonary arterial pressures, identifying the extent and location of chronic thromboemboli, and can determine whether surgical thromboendarterectomy is feasible.
If chronic thromboembolic pulmonary hypertension is identified, it is imperative that patients be referred to a center of excellence specializing in its management regardless of symptom severity, as surgery can be curative and may prevent development of progressive right ventricular dysfunction.36
Our patient’s ventilation-perfusion scan was normal, effectively ruling out the possibility of chronic thromboembolism as a cause of her pulmonary hypertension.
RIGHT HEART CATHETERIZATION
Once the above-mentioned conditions have been evaluated, patients with suspected PAH should be referred to a pulmonary hypertension center of excellence to undergo right heart catheterization. If this test reveals PAH, further vasoreactivity testing should be performed if the etiology of the PAH is considered to be idiopathic, heritable, or drug-induced.1
Vasoreactivity is most commonly tested using 20 ppm of inhaled nitric oxide, but alternative formulations including intravenous epoprostenol, intravenous adenosine, or inhaled iloprost are acceptable. Patients who have a positive vasoreactive test usually respond well to high-dose calcium channel blocker therapy and have a significantly better prognosis than other patients with PAH.37
Patients with WHO group 1 PAH who do not have idiopathic, heritable, or drug-induced PAH have not been shown to have favorable outcomes using calcium channel blockers even if they have a positive vasoreactive response. A positive vasoreactive response is defined as a drop in mean pulmonary arterial pressure of at least 10 mm Hg to an absolute level of 40 mm Hg or less. Cardiac output should be preserved or elevated compared with baseline values during the challenge.1
In reality, only 10% to 15% of patients with idiopathic PAH have a positive vasoreactive response, and half of these patients stop responding within 1 year.38 Therefore, clinicians should not assume that calcium channel blockers will be successful in the long term in a vasoreactive patient, and these patients should have follow-up right heart catheterization after 3 to 6 months and annually thereafter to ensure continued vasoreactivity.1
In patients who are no longer vasoreactive or whose functional status is worse than New York Heart Association functional class I or II, conventional PAH-specific therapy should be started.
LOOKING FOR CAUSES OF ‘IDIOPATHIC’ PAH
Pulmonary hypertension is considered the final common pathway of many varied diseases and syndromes, and therefore one cannot say it is idiopathic without making a robust effort to identify features of alternative causes and rule out other contributing factors.
Although the exact etiology of idiopathic PAH is unclear, well-characterized imbalances in vascular homeostasis have been identified. These include processes that promote vasoconstriction, cell proliferation, and thrombosis (thromboxane A2, endothelin-1, and serotonin) and those that suppress prostacyclin, nitric oxide, and vasoactive intestinal peptide-mediated vasodilation.1 Furthermore, an abnormal angiogenic response to hypoxia and vascular endothelial growth factor has been observed.39
Before considering a diagnosis of idiopathic PAH, a careful history is essential. Other causative agents include appetite-suppressing medications, such as fenfluramine derivatives or stimulants such as amphetamines. Human immunodeficiency virus (HIV) or hepatitis, a history of splenectomy, and prior thyroid or liver disease are also common causes of PAH. Joint pain, myalgias, Raynaud features, or a rash characteristic of connective tissue disease can be identified on history and physical examination. Worldwide, chronic exposure to high-altitude climates and exposure to schistosomiasis are significant causes of PAH, but are rarely seen in developed nations. Confirmatory serum tests for HIV, antinuclear antibody, scleroderma antibody, and thyroid function are essential.1
Genetic factors
If patients report having relatives with possible or probable PAH, genetic counseling is recommended, particularly for rare but causative gene mutations.
BMPR2, the gene that codes for the bone morphogenetic protein receptor type 2, can carry mutations with variable penetrance over the patient’s lifetime depending on other genetic polymorphisms, concurrent inflammation, and the patient’s sex.40
The population carrier estimates of BMPR2 mutations are only 0.001% to 0.01%, but mutations in this gene are identified in approximately 25% of nonfamilial PAH patients and in over 75% of those with a familial inheritance pattern. The BMPR2 protein is a part of the transforming growth factor beta family and is partially responsible for control of vascular cell proliferation. Mutations in this gene lead to PAH at a younger age than in those with mutation-negative idiopathic PAH and to a more severe clinical phenotype in terms of pulmonary vascular resistance and cardiac function.40
Other mutations. Although BMPR2 is the most commonly identified gene mutation in patients with PAH, other gene mutations within this family have also been recognized. These include mutations in the genes for activin receptor-like kinase 1 and endoglin, which, although better known for their association with hereditary hemorrhagic telangiectasia, can lead directly to PAH.40
More recently, a novel autosomal recessive gene mutation in eukaryotic translation initiation factor 2 alpha kinase 4 (EIF2AK4) has been identified in patients with pulmonary veno-occlusive disease41 and pulmonary capillary hemangiomatosis,42 which are specific subclasses of WHO group 1 PAH. The mechanistic parallels between EIF2AK4 and these diseases are not clear, but the prevalence of disease in those with a familial inheritance pattern and an EIF2AK4 mutation is nearly 100%.41 Thus, identification of this mutation has been accepted as a way to confirm pulmonary veno-occlusive disease and pulmonary capillary hemangiomatosis in patients suspected of PAH with features of these diseases.43,44
GROUP 5: MISCELLANEOUS FORMS OF PULMONARY HYPERTENSION
WHO group 5 pulmonary hypertension encompasses disorders whose pathophysiology does not fit neatly within the context of the other pulmonary hypertension subtypes. Nonetheless, appreciation of these disorders is important in determining the etiology and appropriate therapy for patients with pulmonary hypertension. The mechanism driving abnormal pulmonary arterial pressures in patients with group 5 pulmonary hypertension is not always clear and may involve intrinsic or extrinsic factors.1
Diseases within group 5 include those that cause extrinsic compression of the pulmonary arteries (ie, fibrosing mediastinitis) or intrinsic elevations in pulmonary vascular resistance (sarcoidosis, pulmonary Langerhans cell histiocytosis, sickle cell anemia, polycythemia vera, and malignancy).
The most common cause of pulmonary hypertension in this category is sarcoidosis. Current theories suggest that, for most patients, invasion of granulomatous inflammation within the arterial walls induces PAH via fibrotic or inflammatory vascular occlusion. Extrinsic compression due to lymphadenopathy, right or left ventricular dysfunction due to cardiac myocite infiltration, and endothelin-induced pulmonary vasoconstriction are other possible links between the PAH and sarcoidosis.45
PROGNOSTIC RISK STRATIFICATION IN THE PATIENTS WITH PAH

Cardiac magnetic resonance imaging (MRI) has gained popularity as a noninvasive and reproducible alternative to echocardiography. Image fidelity and characterization of right ventricular function and right ventricular ejection fraction are all more accurate than with echocardiography, and serial MRI has proven valuable in its ability to guide patient prognosis.46
However, MRI is more expensive than echocardiography, and some patients cannot tolerate the procedure. In addition, for those who can tolerate it, MRI is not a suitable alternative to right heart catheterization, since it cannot accurately estimate pulmonary artery occlusion pressure or pulmonary arterial pressures.1 For these reasons, cardiac MRI use varies across pulmonary hypertension centers.
A goal of treatment is to reduce a patient’s risk. While no consensus has been achieved over which PAH-specific therapy to start with, evidence is robust that using more than 1 class of agent is beneficial, capitalizing on multiple therapeutic targets.17,47
In our patient, right heart catheterization revealed PAH with a mean pulmonary arterial pressure of 44 mm Hg, pulmonary artery occlusion pressure 6 mm Hg, and a cardiac index of 2.1 L/min/m2. Ancillary testing for alternative causes of PAH was unrevealing, as was vasoreactivity testing. Our patient could walk only 314 meters on her 6-minute walk test and had an initial NT-proBNP level of 750 ng/L.
Based on these and the findings during her evaluation, she would be classified as having intermediate-risk PAH with an estimated 1-year mortality risk of 5% to 10%.1 Appropriate therapy and follow-up would be guided by this determination. Specific therapy is beyond the scope of this article but we would start her on dual oral therapy with close follow-up to reassess her 1-year mortality risk. If there were no improvement over a short period of time, we would add further therapy.
- Galiè N, Humbert M, Vachiery JL, et al. 2015 ESC/ERS guidelines for the diagnosis and treatment of pulmonary hypertension: the Joint Task Force for the Diagnosis and Treatment of Pulmonary Hypertension of the European Society of Cardiology (ESC) and the European Respiratory Society (ERS): Endorsed by: Association for European Paediatric and Congenital Cardiology (AEPC), International Society for Heart and Lung Transplantation (ISHLT). Eur Respir J 2015; 46(4):903–975. doi:10.1183/13993003.01032-2015
- Galiè N, Rubin LJ, Hoeper M, et al. Treatment of patients with mildly symptomatic pulmonary arterial hypertension with bosentan (EARLY study): a double-blind, randomized controlled trial. Lancet 2008; 371(9630):2093–2100. doi:10.1016/S0140-6736(08)60919-8
- Howard LS. Prognostic factors in pulmonary arterial hypertension: assessing the course of the disease. Eur Respir Rev 2011; 20:236–242. doi:10.1183/09059180.00006711
- Brown LM, Chen H, Halpern S, et al. Delay in recognition of pulmonary arterial hypertension: factors identified from the REVEAL registry. Chest 2011; 140:19–26. doi:10.1378/chest.10-1166
- Elliot CG, Farber H, Frost A, Liou TG, Turner M. REVEAL Registry: medical history and time to diagnosis of enrolled patients. Chest 2007; 132(4):631a. doi:10.1378/chest.132.4_MeetingAbstracts.631a
- Minai OA, Budev MM. Diagnostic strategies for suspected pulmonary arterial hypertension: a primer for the internist. Cleve Clin J Med 2007; 74(10):737–747. pmid:17941295
- Badesch DB, Raskob GE, Elliott CG, et al. Pulmonary arterial hypertension: baseline characteristics from the REVEAL registry. Chest 2010; 137(2):376–387. doi:10.1378/chest.09-1140
- Fisher MR, Forfia PR, Chamera E, et al. Accuracy of Doppler echocardiography in the hemodynamic assessment of pulmonary hypertension. Am J Respir Crit Care Med 2009; 179(7):615–621. doi:10.1164/rccm.200811-1691OC
- Robbins IM, Newman JH, Johnson RF, et al. Association of the metabolic syndrome with pulmonary venous hypertension. Chest 2009; 136(1):31–36. doi:10.1378/chest.08-2008
- Rosenkranz S, Gibbs JS, Wachter R, De Marco T, Vonk-Noordegraaf A, Vachiery JL. Left ventricular heart failure and pulmonary hypertension. Eur Heart J 2016; 37(12):942–954. doi:10.1093/eurheartj/ehv512
- Opitz CF, Hoeper MM, Gibbs JSR, et al. Pre-capillary, combined, and post-capillary pulmonary hypertension: a pathophysiological continuum. J Am Coll Cardiol 2016; 68:368–378. doi: 10.1016/j.jacc.2016.05.047
- Robbins IM, Hemnes AR, Pugh ME, et al. High prevalence of occult pulmonary venous hypertension revealed by fluid challenge in pulmonary hypertension. Circ Heart Fail 2014; 7(1):116–122. doi:10.1161/CIRCHEARTFAILURE.113.000468
- Gerges C, Gerges M, Lang MB, et al. Diastolic pulmonary vascular pressure gradient: a predictor of prognosis in “out-of-proportion” pulmonary hypertension. Chest 2013; 143(3):758–766. doi:10.1378/chest.12-1653
- Task Force for Diagnosis and Treatment of Pulmonary Hypertension of European Society of Cardiology (ESC); European Respiratory Society (ERS); International Society of Heart and Lung Transplantation (ISHLT); Galiè N, Hoeper MM, Humbert M, et al. Guidelines for the diagnosis and treatment of pulmonary hypertension. Eur Respir J 2009; 34(6):1219–1263. doi:10.1183/09031936.00139009
- Naeije R, Vachiery JL, Yerly P, Vanderpool R. The transpulmonary pressure gradient for the diagnosis of pulmonary vascular disease. Eur Respir J 2013; 41(1):217–223. doi:10.1183/09031936.00074312
- Frost AE, Badesch DB, Miller DP, Benza RL, Meltzer LA, McGoon MD. Evaluation of the predictive value of a clinical worsening definition using 2-year outcomes in patients with pulmonary arterial hypertension: a REVEAL registry analysis. Chest 2013; 144(5):1521–1529. doi:10.1378/chest.12-3023
- Galiè N, Barberà JA, Frost AE, et al; AMBITION Investigators. Initial use of ambrisentan plus tadalafil in pulmonary arterial hypertension. N Engl J Med 2015; 373(9):834–844. doi:10.1056/NEJMoa1413687
- Farr G, Shah K, Markley R, Abbate A, Salloum FN, Grinnan D. Development of pulmonary hypertension in heart failure with preserved ejection fraction. Prog Cardiovasc Dis 2016; 59(1):52–58. doi:10.1016/j.pcad.2016.06.002
- Hoeper MM, Barberà JA, Channick RN, et al. Diagnosis, assessment, and treatment of non-pulmonary arterial hypertension pulmonary hypertension. J Am Coll Cardiol 2009; 54(suppl 1):S85–S96. doi:10.1016/j.jacc.2009.04.008
- Chaouat A, Naeije R, Weitzenblum E. Pulmonary hypertension in COPD. Eur Respir J 2008; 32(5):1371–1385. doi:10.1183/09031936.00015608
- Minai OA, Ricaurte B, Kaw R, et al. Frequency and impact of pulmonary hypertension in patients with obstructive sleep apnea syndrome. Am J Cardiol 2009; 104(9):1300–1306. doi:10.1016/j.amjcard.2009.06.048
- Kholdani C, Fares WH, Mohsenin V. Pulmonary hypertension in obstructive sleep apnea: is it clinically significant? A critical analysis of the association and pathophysiology. Pulm Circ 2015; 5(2):220–227. doi:10.1086/679995
- Prisco DL, Sica AL, Talwar A, et al. Correlation of pulmonary hypertension severity with metrics of comorbid sleep-disordered breathing. Sleep Breath 2011; 15(4):633–639. doi:10.1007/s11325-010-0411-y
- Dumitrascu R, Tiede H, Eckermann J, et al. Sleep apnea in precapillary pulmonary hypertension. Sleep Med 2013; 14(3):247–251. doi:10.1016/j.sleep.2012.11.013
- Arcasoy SM, Christie JD, Ferrari VA, et al. Echocardiographic assessment of pulmonary hypertension in patients with advanced lung disease. Am J Respir Crit Care Med 2003; 167(5):735–740. doi:10.1164/rccm.200210-1130OC
- Pepke-Zaba J, Jansa P, Kim NH, Naeije R, Simonneau G. Chronic thromboembolic pulmonary hypertension: role of medical therapy. Eur Respir J 2013; 41(4):985–990. doi:10.1183/09031936.00201612
- Guérin L, Couturaud F, Parent F, et al. Prevalence of chronic thromboembolic pulmonary hypertension after acute pulmonary embolism. Prevalence of CTEPH after pulmonary embolism. Thromb Haemost 2014; 112(3):598–605. doi:10.1160/TH13-07-0538
- Lang IM, Pesavento R, Bonderman D, Yuan JX. Risk factors and basic mechanisms of chronic thromboembolic pulmonary hypertension: a current understanding. Eur Respir J 2013; 41(2):462–468. doi:10.1183/09031936.00049312
- Pepke-Zaba J. Diagnostic testing to guide the management of chronic thromboembolic pulmonary hypertension: state of the art. Eur Respir Rev 2010; 19(115):55–58. doi:10.1183/09059180.00007209
- Bonderman D, Turecek PL, Jakowitsch J, et al. High prevalence of elevated clotting factor VIII in chronic thromboembolic pulmonary hypertension. Thromb Haemost 2003; 90(3):372–376. doi:10.1160/TH03-02-0067
- Pepke-Zaba J, Delcroix M, Lang I, et al. Chronic thromboembolic pulmonary hypertension (CTEPH): results from an international prospective registry. Circulation 2011; 124(18):1973–1981. doi:10.1161/CIRCULATIONAHA.110.015008
- Kim NH, Delcroix M, Jenkins DP, et al. Chronic thromboembolic pulmonary hypertension. J Am Coll Cardiol 2013; 62:(suppl 25):D92–D99. doi:10.1016/j.jacc.2013.10.024
- Moser KM, Auger WR, Fedullo PF. Chronic major-vessel thromboembolic pulmonary hypertension. Circulation 1990; 81(6):1735–1743. pmid:2188751
- McNeil K, Dunning J. Chronic thromboembolic pulmonary hypertension (CTEPH). Heart 2007; 93(9):1152–1158. doi:10.1136/hrt.2004.053603
- Tunariu N, Gibbs SJ, Win Z, et al. Ventilation-perfusion scintigraphy is more sensitive than multidetector CTPA in detecting chronic thromboembolic pulmonary disease as a treatable cause of pulmonary hypertension. J Nucl Med 2007; 48(5):680–684. doi:10.2967/jnumed.106.039438
- Fedullo P, Kerr KM, Kim NH, Auger WR. Chronic thromboembolic pulmonary hypertension. Am J Respir Crit Care Med 2011; 183(12):1605–1613. doi:10.1164/rccm.201011-1854CI
- Rich S, Kaufmann E, Levy PS. The effect of high doses of calcium-channel blockers on survival in primary pulmonary hypertension. N Engl J Med 1992; 327(2):76–81. doi:10.1056/NEJM199207093270203
- Sitbon O, Humbert M, Jaıs X, et al. Long-term response to calcium channel blockers in idiopathic pulmonary arterial hypertension. Circulation 2005; 111(23):3105–3111. doi:10.1161/CIRCULATIONAHA.104.488486
- Chin KM, Rubin LJ. Pulmonary arterial hypertension. J Am Coll Cardiol 2008; 51(16):1527–1538. doi:10.1016/j.jacc.2008.01.024
- Soubrier F, Chung WK, Machado R, et al. Genetics and genomics of pulmonary arterial hypertension. J Am Coll Cardiol 2013; 62(suppl 25):D13–D21. doi:10.1016/j.jacc.2013.10.035
- Eyries M, Montani D, Girerd B, et al. EIF2AK4 mutations cause pulmonary veno-occlusive disease, a recessive form of pulmonary hypertension. Nat Genet 2014; 46(1):65–69. doi: 10.1038/ng.2844
- Best DH, Sumner KL, Austin ED, et al. EIF2AK4 mutations in pulmonary capillary hemangiomatosis. Chest 2014; 145(2):231–236. doi:10.1378/chest.13-2366
- Best DH, Sumner KL, Smith BP, et al. EIF2AK4 mutations in patients diagnosed with pulmonary arterial hypertension. Chest 2017; 151(4):821–828. doi:10.1016/j.chest.2016.11.014
- Hadinnapola C, Bleda M, Haimel M, et al; NIHR BioResource–Rare Diseases Consortium; UK National Cohort Study of Idiopathic and Heritable PAH. Phenotypic characterization of EIF2AK4 mutation carriers in a large cohort of patients diagnosed clinically with pulmonary arterial hypertension. Circulation 2017; 136(21):2022–2033. doi:10.1161/CIRCULATIONAHA.117.028351
- Diaz-Guzman E, Farver C, Parambil J, Culver DA. Pulmonary hypertension caused by sarcoidosis. Clin Chest Med 2008; 29(3):549–563. doi:10.1016/j.ccm.2008.03.010
- Mauritz GJ, Kind T, Marcus JT, et al. Progressive changes in right ventricular geometric shortening and long-term survival in pulmonary arterial hypertension. Chest 2012; 141(4):935–943. doi:10.1378/chest.10-3277
- Galiè N, Palazzini M, Manes A. Pulmonary arterial hypertension: from the kingdom of the near-dead to multiple clinical trial meta-analyses. Eur Heart J 2010; 31(17):2080–2086. doi:10.1093/eurheartj/ehq152
Pulmonary arterial hypertension (PAH) is a hemodynamic disorder that affects small and medium-size pulmonary arteries through cellular proliferation and luminal narrowing.1 Increased pulmonary vascular resistance causes restricted blood flow in these arteries, leading to elevated pulmonary arterial pressure and afterload on the right ventricle. Despite advances in therapy, death usually occurs as a result of right ventricular failure.
- Group 1—PAH, due to narrowed pulmonary arteries
- Group 2—due to left heart disease
- Group 3—due to lung disease or hypoxia, or both
- Group 4—due to chronic thromboembolism or other pulmonary artery obstruction
- Group 5—due to uncertain or multifactorial causes.
Experts recognize the morbidity and mortality associated with pulmonary hypertension now more than in the past, and they emphasize recognizing it early. Guidelines for its diagnosis and treatment were updated in 2015.1
Below, we use a case to discuss recommendations for initial evaluation and classification of pulmonary hypertension, particularly PAH.
A PATIENT SUSPECTED OF HAVING PULMONARY HYPERTENSION
A 63-year-old woman with a 25-pack-year history of tobacco use, as well as pulmonary embolism and coronary artery disease, presents to her primary care physician with exertional dyspnea. She had been a clerk at a hardware store and physically active until she took early retirement 8 months ago because of increasing fatigue. She initially felt the fatigue was simply “a sign of getting old.”
Since retiring, she has noticed the slow onset of progressive dyspnea on exertion. She can no longer climb more than 1 flight of stairs or walk more than 1 block. She also complains of mild, fluctuating edema in her lower extremities over the past month. She quit smoking 8 years ago after undergoing placement of a drug-eluting stent in the mid-left circumflex artery. After this, she received clopidogrel and was followed by a cardiologist for 2 years but stopped taking the medication because of bruising. She has not seen her cardiologist in more than 5 years.
She underwent elective right total knee arthroplasty 3 years ago, complicated by acute deep vein thrombosis in the right common femoral vein. Computed tomography (CT) at that time did not reveal pulmonary emboli. She received warfarin therapy for 3 months.
She reports no current cough, chest pain, lightheadedness, or syncope. She has no orthopnea, and she feels normal at rest.
Her family history is unremarkable, and she has had no exposure to illicit substances, environmental toxins, or dietary supplements. She takes aspirin 81 mg daily, metoprolol 25 mg twice daily, lisinopril 10 mg daily, and simvastatin 40 mg at bedtime.
Her primary care physician detects a murmur in the left lower sternal border and sends her for transthoracic echocardiography, which demonstrates mild right ventricular dilation, right atrial dilation, and mildly reduced right ventricular function. The calculated right ventricular systolic pressure is 69 mm Hg. The left ventricle shows mild concentric hypertrophy; the left atrium is normal in size.
DIAGNOSTIC EVALUATION OF SUSPECTED PULMONARY HYPERTENSION
CLINICAL MANIFESTATIONS
Symptoms and signs. As in the patient described above, the first symptoms such as exertional dyspnea, fatigue, and lightheadedness usually arise in situations that call for increased cardiac output.4 As right ventricular function worsens, symptoms start to occur at rest, and signs of increased right ventricular preload appear, such as abdominal and lower-extremity edema and pericardial effusion. Syncope is a sign of severe right ventricular dysfunction.5
Physical examination. Look for signs of increased right ventricular loading and failure, eg:
- An accentuated intensity and persistent splitting of the second heart sound
- A prominent parasternal heave
- A prominent jugular “a” wave
- A systolic murmur along the left sternal border at the fourth intercostal space, which may worsen with breath-holding
- Pitting lower-extremity edema
- Hepatomegaly
- Hepatojugular reflux
- Hepatic pulsatility.6
ECHOCARDIOGRAPHY IN SUSPECTED PULMONARY HYPERTENSION
Many practitioners rely heavily on the estimated right ventricular systolic pressure in diagnosing pulmonary hypertension. In theory, this number should be nearly the same as the pulmonary arterial systolic pressure. However, technical and patient-related aspects of transthoracic echocardiography often limit accurate measurement of the right ventricular systolic pressure, and readings often differ from those measured with right heart catheterization.8
Our patient had a markedly elevated right ventricular systolic pressure and signs of right ventricular dysfunction, suggesting a high probability of pulmonary hypertension.
EVALUATING LEFT HEART DISEASE (WHO GROUP 2)
More than 75% of cases of pulmonary hypertension are directly related to left ventricular dysfunction or mitral or aortic valve disease (WHO group 2).1 Since group 2 differs markedly from group 1 (PAH) in its pathophysiology and treatment, it is important to distinguish between them.
Compared with WHO group 1 patients, those in group 2 tend to be older, more of them are male, and more of them have comorbidities such as metabolic syndrome, hypertension, and coronary artery disease.1,9 A combination of risk factors and clinical findings should be considered in identifying these patients.10
Transthoracic echocardiography is used to detect features of systolic and diastolic dysfunction. Left atrial enlargement is a clue that left heart disease may be present. In addition, signs of left ventricular or valvular dysfunction on electrocardiography or chest radiography are often helpful.
When estimated right ventricular systolic pressures are only minimally abnormal and no significant right ventricular dysfunction exists, further diagnostic evaluation is not warranted. However, because no single identifying feature or variable can readily distinguish group 2 from the other WHO groups, further evaluation should be considered if the right ventricular systolic pressure is significantly elevated or right ventricular dysfunction exists.
Our patient had several risk factors for left heart disease, including a history of smoking and coronary artery disease. Nonetheless, findings consistent with severe right ventricular dysfunction necessitated further evaluation for other possible causes of her suspected pulmonary hypertension.
Postcapillary pulmonary hypertension
In patients for whom further evaluation is pursued, the diagnosis of WHO group 2 pulmonary hypertension is ultimately based on findings consistent with postcapillary or “passive” pulmonary hypertension on right heart catheterization. Although mean pulmonary arterial pressures must be at least 25 mm Hg to certify the diagnosis of pulmonary hypertension, a pulmonary artery occlusion pressure greater than 15 mm Hg (normal 6–12) and pulmonary vascular resistance of 3 Wood units or less (normal 0.3–1.6) suggests the pulmonary hypertension is due to elevated left atrial pressure (ie, postcapillary) rather than precapillary pulmonary arterial remodeling.
Mixed pre- and postcapillary pulmonary hypertension
Distinguishing pulmonary venous hypertension from PAH is important, since their management differs. In particular, PAH-specific therapies (ie, prostacyclin analogues, prostaglandin I2 receptor agonists, endothelin receptor antagonists, phosphodiesterase-5 inhibitors, and cyclic guanosine monophosphate stimulators) can have a detrimental effect in WHO group 2 patients by causing increased pulmonary capillary leakage with pulmonary edema.11,12
In some patients, chronic passive congestion in the pulmonary venous circulation causes additional disruption of the homeostatic milieu regulating precapillary smooth muscle and endothelial function. These changes result in structural remodeling of precapillary arterioles and increased precapillary vascular resistance, creating a “mixed” pulmonary hypertension with both pre- and postcapillary abnormalities.
There is controversy over the ideal way to identify these patients but little disagreement that they face a worse prognosis than those without precapillary remodeling.13 In light of this, efforts have been made to characterize this cohort.
Historically, mixed pre- and postcapillary pulmonary hypertension was defined as the combination of all of the following:
- Mean pulmonary arterial pressure ≥ 25 mm Hg
- Pulmonary artery occlusion pressure > 15 mm Hg
- Transpulmonary gradient (the mean pulmonary arterial pressure minus the pulmonary artery occlusion pressure) > 12 mm Hg.14
However, the utility of the transpulmonary gradient for distinguishing mixed pulmonary hypertension has been questioned because of concerns over its susceptibility to variations in stroke volume and loading conditions.15
The diastolic pulmonary gradient (the pulmonary arterial diastolic pressure minus the pulmonary artery occlusion pressure) has been proposed as an alternative to the transpulmonary gradient under the theory that it is less sensitive to fluctuation from variations in flow or loading.15
Current guidelines1 suggest that a patient who has all of the following should be considered to have mixed pulmonary hypertension:
- A mean pulmonary arterial pressure > 25 mm Hg
- A pulmonary artery occlusion pressure > 15 mm Hg
- A diastolic pulmonary gradient > 7 mm Hg or a pulmonary vascular resistance > 3 Wood units, or both.
Occult group 2 pulmonary hypertension
Currently, the diagnosis of WHO group 2 pulmonary hypertension is based on elevated resting pulmonary artery occlusion pressure. However, some patients with WHO group 2 pulmonary hypertension and transiently low preload from aggressive diuresis or fasting may have a low pulmonary artery occlusion pressure during right heart catheterization and be misdiagnosed as having WHO group 1 PAH.12,16
This concern was acknowledged in the 2015 Ambrisentan and Tadalafil in Patients With Pulmonary Arterial Hypertension (AMBITION) study after investigators changed the protocol to exclude patients who technically met the criteria for WHO group 1 PAH, but had borderline-elevated pulmonary artery occlusion pressure and additional risk factors worrisome for left heart disease and occult WHO group 2 pulmonary hypertension.17,18
Several strategies, including passive leg-raising, fluid challenge, and exercise during diagnostic right heart catheterization, have been proposed to better classify these patients.19 Unfortunately, due to a lack of standardization of normal values and methodology for executing these maneuvers, consensus is lacking over their routine use, and recommendations for their use have not been provided.1
EVALUATION OF LUNG DISEASE (WHO GROUP 3)
All patients with suspected pulmonary hypertension should also be assessed for underlying pulmonary parenchymal or physiologic disease.
WHO group 3 consists of pulmonary disorders that, over an extended time, can lead to pulmonary hypertension. The most common of these disorders include chronic obstructive pulmonary disease, interstitial lung disease, and combined pulmonary fibrosis and emphysema.1
Pulmonary hypertension in these patients is precapillary, and changes in pulmonary vascular resistance are influenced by multiple factors, the most significant of which is alveolar hypoxia. Hypoxia induces pulmonary artery vasoconstrictionn (in contrast to the reflexive hemodynamics seen in peripheral tissues, where systemic vascular tone is generally lower in states of hypoxia) as a mechanism to divert pulmonary blood flow to well-ventilated portions of the lung and maintain ventilation-perfusion matching.
Repeated chronic hypoxia also alters cellular structure and function of pulmonary vessels and leads to medial hypertrophy and increased vascular tone, thus contributing to the development of pulmonary hypertension in many of these patients.20
Obstructive sleep apnea. Up to 70% of patients with obstructive sleep apnea have pulmonary hypertension.21 Chronic repetitive hypoxia throughout the night increases the levels of reactive oxygen species and alters cellular and molecular signaling, thus inducing vascular remodeling. In addition, apneic events during sleep promote catecholamine-driven elevations in systemic blood pressure. Over time, patients are at higher risk of developing left ventricular dysfunction and concomitant postcapillary group 2 pulmonary hypertension.22 Because typical methods of obstructive sleep apnea screening (eg, the Epworth Sleep Scale) have been historically poor at discriminating PAH patients with obstructive sleep apnea from those without, patients diagnosed with PAH should be considered for formal sleep testing.23,24
Pulmonary function tests, chest imaging
Pulmonary function tests and high-resolution computed tomography are essential to any PAH evaluation and help to exclude WHO group 3 pulmonary hypertension.1
An abnormal result on CT or spirometry can help point toward parenchymal lung disease. Normal spirometry and lung volumes with an isolated reduction in the diffusing capacity of the lung for carbon monoxide (Dlco) is typical of patients with WHO group 1 PAH.
In our patient, CT of the chest did not show any evidence of parenchymal lung disease, and pulmonary function tests showed no evidence of obstruction or restriction. There was a moderate decrease in Dlco, which did not reach normal limits when adjusted for lung volumes. In this setting, further evaluation of her PAH was warranted.
EVALUATION OF THROMBOEMBOLIC DISEASE (WHO GROUP 4)
Once pulmonary hypertension due to underlying left heart disease or parenchymal lung disease has been excluded, testing for chronic thromboembolic pulmonary hypertension is necessary, even in the absence of prior known pulmonary embolism. Identifying these patients is paramount, as chronic thromboembolic pulmonary hypertension (WHO group 4) is the only type of pulmonary hypertension for which a definitive cure is available.26
Up to 9% of patients who survive acute pulmonary embolism exhibit features of chronic proximal thrombosis and remodeling of distal pulmonary arteries.27
It remains unknown exactly why some patients develop chronic thromboembolic pulmonary hypertension and others do not, but the pathophysiology involves inappropriate thrombus resolution after venous thromboembolic events. Monocyte recruitment (which plays an important role in thrombus resolution) is reduced, angiogenesis is impaired (preventing effective vascular collateralization), and abnormal fibroblast proliferation leads to distal pulmonary vascular wall thickening.28 There is some evidence of increased thrombophilic risk in this population, and approximately 10% to 20% of patients are positive for antiphospholipid antibodies or lupus anticoagulant.29,30
Patients with chronic thromboembolic pulmonary hypertension usually present with symptoms similar to those of WHO group 1 PAH. Up to one-quarter of patients have no recollection of prior pulmonary embolism.31 As the disease progresses, signs and symptoms related to elevated pulmonary vascular resistance and right ventricular dysfunction are common.32,33
Although thrombi usually resolve quickly, the diagnosis of chronic thromboembolic pulmonary hypertension should be made only after at least 3 months of appropriate anticoagulation to avoid treatment of transient hemodynamic changes often seen after an acute pulmonary embolism.1
Radiographic changes associated with chronic thromboembolic pulmonary hypertension are distinct from the intraluminal filling defects seen with acute thromboembolism, since chronic thrombi tend to become organized and eccentric. On imaging, one may see features of rapid luminal narrowing or eccentric filling defects rather than the conventional central filling defects of acute pulmonary embolism. These changes are often overlooked by radiologists who are not specifically looking for chronic thromboembolic pulmonary hypertension.34 For this reason, the sensitivity and specificity of identifying chronic thromboembolic disease using radionuclide ventilation-perfusion lung scanning is superior to that of CT angiography.
All patients with suspected PAH should undergo a ventilation-perfusion scan.1,35 In patients with ventilation-perfusion mismatch on radionuclide scanning, pulmonary angiography can fulfill multiple goals of measuring pulmonary arterial pressures, identifying the extent and location of chronic thromboemboli, and can determine whether surgical thromboendarterectomy is feasible.
If chronic thromboembolic pulmonary hypertension is identified, it is imperative that patients be referred to a center of excellence specializing in its management regardless of symptom severity, as surgery can be curative and may prevent development of progressive right ventricular dysfunction.36
Our patient’s ventilation-perfusion scan was normal, effectively ruling out the possibility of chronic thromboembolism as a cause of her pulmonary hypertension.
RIGHT HEART CATHETERIZATION
Once the above-mentioned conditions have been evaluated, patients with suspected PAH should be referred to a pulmonary hypertension center of excellence to undergo right heart catheterization. If this test reveals PAH, further vasoreactivity testing should be performed if the etiology of the PAH is considered to be idiopathic, heritable, or drug-induced.1
Vasoreactivity is most commonly tested using 20 ppm of inhaled nitric oxide, but alternative formulations including intravenous epoprostenol, intravenous adenosine, or inhaled iloprost are acceptable. Patients who have a positive vasoreactive test usually respond well to high-dose calcium channel blocker therapy and have a significantly better prognosis than other patients with PAH.37
Patients with WHO group 1 PAH who do not have idiopathic, heritable, or drug-induced PAH have not been shown to have favorable outcomes using calcium channel blockers even if they have a positive vasoreactive response. A positive vasoreactive response is defined as a drop in mean pulmonary arterial pressure of at least 10 mm Hg to an absolute level of 40 mm Hg or less. Cardiac output should be preserved or elevated compared with baseline values during the challenge.1
In reality, only 10% to 15% of patients with idiopathic PAH have a positive vasoreactive response, and half of these patients stop responding within 1 year.38 Therefore, clinicians should not assume that calcium channel blockers will be successful in the long term in a vasoreactive patient, and these patients should have follow-up right heart catheterization after 3 to 6 months and annually thereafter to ensure continued vasoreactivity.1
In patients who are no longer vasoreactive or whose functional status is worse than New York Heart Association functional class I or II, conventional PAH-specific therapy should be started.
LOOKING FOR CAUSES OF ‘IDIOPATHIC’ PAH
Pulmonary hypertension is considered the final common pathway of many varied diseases and syndromes, and therefore one cannot say it is idiopathic without making a robust effort to identify features of alternative causes and rule out other contributing factors.
Although the exact etiology of idiopathic PAH is unclear, well-characterized imbalances in vascular homeostasis have been identified. These include processes that promote vasoconstriction, cell proliferation, and thrombosis (thromboxane A2, endothelin-1, and serotonin) and those that suppress prostacyclin, nitric oxide, and vasoactive intestinal peptide-mediated vasodilation.1 Furthermore, an abnormal angiogenic response to hypoxia and vascular endothelial growth factor has been observed.39
Before considering a diagnosis of idiopathic PAH, a careful history is essential. Other causative agents include appetite-suppressing medications, such as fenfluramine derivatives or stimulants such as amphetamines. Human immunodeficiency virus (HIV) or hepatitis, a history of splenectomy, and prior thyroid or liver disease are also common causes of PAH. Joint pain, myalgias, Raynaud features, or a rash characteristic of connective tissue disease can be identified on history and physical examination. Worldwide, chronic exposure to high-altitude climates and exposure to schistosomiasis are significant causes of PAH, but are rarely seen in developed nations. Confirmatory serum tests for HIV, antinuclear antibody, scleroderma antibody, and thyroid function are essential.1
Genetic factors
If patients report having relatives with possible or probable PAH, genetic counseling is recommended, particularly for rare but causative gene mutations.
BMPR2, the gene that codes for the bone morphogenetic protein receptor type 2, can carry mutations with variable penetrance over the patient’s lifetime depending on other genetic polymorphisms, concurrent inflammation, and the patient’s sex.40
The population carrier estimates of BMPR2 mutations are only 0.001% to 0.01%, but mutations in this gene are identified in approximately 25% of nonfamilial PAH patients and in over 75% of those with a familial inheritance pattern. The BMPR2 protein is a part of the transforming growth factor beta family and is partially responsible for control of vascular cell proliferation. Mutations in this gene lead to PAH at a younger age than in those with mutation-negative idiopathic PAH and to a more severe clinical phenotype in terms of pulmonary vascular resistance and cardiac function.40
Other mutations. Although BMPR2 is the most commonly identified gene mutation in patients with PAH, other gene mutations within this family have also been recognized. These include mutations in the genes for activin receptor-like kinase 1 and endoglin, which, although better known for their association with hereditary hemorrhagic telangiectasia, can lead directly to PAH.40
More recently, a novel autosomal recessive gene mutation in eukaryotic translation initiation factor 2 alpha kinase 4 (EIF2AK4) has been identified in patients with pulmonary veno-occlusive disease41 and pulmonary capillary hemangiomatosis,42 which are specific subclasses of WHO group 1 PAH. The mechanistic parallels between EIF2AK4 and these diseases are not clear, but the prevalence of disease in those with a familial inheritance pattern and an EIF2AK4 mutation is nearly 100%.41 Thus, identification of this mutation has been accepted as a way to confirm pulmonary veno-occlusive disease and pulmonary capillary hemangiomatosis in patients suspected of PAH with features of these diseases.43,44
GROUP 5: MISCELLANEOUS FORMS OF PULMONARY HYPERTENSION
WHO group 5 pulmonary hypertension encompasses disorders whose pathophysiology does not fit neatly within the context of the other pulmonary hypertension subtypes. Nonetheless, appreciation of these disorders is important in determining the etiology and appropriate therapy for patients with pulmonary hypertension. The mechanism driving abnormal pulmonary arterial pressures in patients with group 5 pulmonary hypertension is not always clear and may involve intrinsic or extrinsic factors.1
Diseases within group 5 include those that cause extrinsic compression of the pulmonary arteries (ie, fibrosing mediastinitis) or intrinsic elevations in pulmonary vascular resistance (sarcoidosis, pulmonary Langerhans cell histiocytosis, sickle cell anemia, polycythemia vera, and malignancy).
The most common cause of pulmonary hypertension in this category is sarcoidosis. Current theories suggest that, for most patients, invasion of granulomatous inflammation within the arterial walls induces PAH via fibrotic or inflammatory vascular occlusion. Extrinsic compression due to lymphadenopathy, right or left ventricular dysfunction due to cardiac myocite infiltration, and endothelin-induced pulmonary vasoconstriction are other possible links between the PAH and sarcoidosis.45
PROGNOSTIC RISK STRATIFICATION IN THE PATIENTS WITH PAH
Cardiac magnetic resonance imaging (MRI) has gained popularity as a noninvasive and reproducible alternative to echocardiography. Image fidelity and characterization of right ventricular function and right ventricular ejection fraction are all more accurate than with echocardiography, and serial MRI has proven valuable in its ability to guide patient prognosis.46
However, MRI is more expensive than echocardiography, and some patients cannot tolerate the procedure. In addition, for those who can tolerate it, MRI is not a suitable alternative to right heart catheterization, since it cannot accurately estimate pulmonary artery occlusion pressure or pulmonary arterial pressures.1 For these reasons, cardiac MRI use varies across pulmonary hypertension centers.
A goal of treatment is to reduce a patient’s risk. While no consensus has been achieved over which PAH-specific therapy to start with, evidence is robust that using more than 1 class of agent is beneficial, capitalizing on multiple therapeutic targets.17,47
In our patient, right heart catheterization revealed PAH with a mean pulmonary arterial pressure of 44 mm Hg, pulmonary artery occlusion pressure 6 mm Hg, and a cardiac index of 2.1 L/min/m2. Ancillary testing for alternative causes of PAH was unrevealing, as was vasoreactivity testing. Our patient could walk only 314 meters on her 6-minute walk test and had an initial NT-proBNP level of 750 ng/L.
Based on these and the findings during her evaluation, she would be classified as having intermediate-risk PAH with an estimated 1-year mortality risk of 5% to 10%.1 Appropriate therapy and follow-up would be guided by this determination. Specific therapy is beyond the scope of this article but we would start her on dual oral therapy with close follow-up to reassess her 1-year mortality risk. If there were no improvement over a short period of time, we would add further therapy.
- Galiè N, Humbert M, Vachiery JL, et al. 2015 ESC/ERS guidelines for the diagnosis and treatment of pulmonary hypertension: the Joint Task Force for the Diagnosis and Treatment of Pulmonary Hypertension of the European Society of Cardiology (ESC) and the European Respiratory Society (ERS): Endorsed by: Association for European Paediatric and Congenital Cardiology (AEPC), International Society for Heart and Lung Transplantation (ISHLT). Eur Respir J 2015; 46(4):903–975. doi:10.1183/13993003.01032-2015
- Galiè N, Rubin LJ, Hoeper M, et al. Treatment of patients with mildly symptomatic pulmonary arterial hypertension with bosentan (EARLY study): a double-blind, randomized controlled trial. Lancet 2008; 371(9630):2093–2100. doi:10.1016/S0140-6736(08)60919-8
- Howard LS. Prognostic factors in pulmonary arterial hypertension: assessing the course of the disease. Eur Respir Rev 2011; 20:236–242. doi:10.1183/09059180.00006711
- Brown LM, Chen H, Halpern S, et al. Delay in recognition of pulmonary arterial hypertension: factors identified from the REVEAL registry. Chest 2011; 140:19–26. doi:10.1378/chest.10-1166
- Elliot CG, Farber H, Frost A, Liou TG, Turner M. REVEAL Registry: medical history and time to diagnosis of enrolled patients. Chest 2007; 132(4):631a. doi:10.1378/chest.132.4_MeetingAbstracts.631a
- Minai OA, Budev MM. Diagnostic strategies for suspected pulmonary arterial hypertension: a primer for the internist. Cleve Clin J Med 2007; 74(10):737–747. pmid:17941295
- Badesch DB, Raskob GE, Elliott CG, et al. Pulmonary arterial hypertension: baseline characteristics from the REVEAL registry. Chest 2010; 137(2):376–387. doi:10.1378/chest.09-1140
- Fisher MR, Forfia PR, Chamera E, et al. Accuracy of Doppler echocardiography in the hemodynamic assessment of pulmonary hypertension. Am J Respir Crit Care Med 2009; 179(7):615–621. doi:10.1164/rccm.200811-1691OC
- Robbins IM, Newman JH, Johnson RF, et al. Association of the metabolic syndrome with pulmonary venous hypertension. Chest 2009; 136(1):31–36. doi:10.1378/chest.08-2008
- Rosenkranz S, Gibbs JS, Wachter R, De Marco T, Vonk-Noordegraaf A, Vachiery JL. Left ventricular heart failure and pulmonary hypertension. Eur Heart J 2016; 37(12):942–954. doi:10.1093/eurheartj/ehv512
- Opitz CF, Hoeper MM, Gibbs JSR, et al. Pre-capillary, combined, and post-capillary pulmonary hypertension: a pathophysiological continuum. J Am Coll Cardiol 2016; 68:368–378. doi: 10.1016/j.jacc.2016.05.047
- Robbins IM, Hemnes AR, Pugh ME, et al. High prevalence of occult pulmonary venous hypertension revealed by fluid challenge in pulmonary hypertension. Circ Heart Fail 2014; 7(1):116–122. doi:10.1161/CIRCHEARTFAILURE.113.000468
- Gerges C, Gerges M, Lang MB, et al. Diastolic pulmonary vascular pressure gradient: a predictor of prognosis in “out-of-proportion” pulmonary hypertension. Chest 2013; 143(3):758–766. doi:10.1378/chest.12-1653
- Task Force for Diagnosis and Treatment of Pulmonary Hypertension of European Society of Cardiology (ESC); European Respiratory Society (ERS); International Society of Heart and Lung Transplantation (ISHLT); Galiè N, Hoeper MM, Humbert M, et al. Guidelines for the diagnosis and treatment of pulmonary hypertension. Eur Respir J 2009; 34(6):1219–1263. doi:10.1183/09031936.00139009
- Naeije R, Vachiery JL, Yerly P, Vanderpool R. The transpulmonary pressure gradient for the diagnosis of pulmonary vascular disease. Eur Respir J 2013; 41(1):217–223. doi:10.1183/09031936.00074312
- Frost AE, Badesch DB, Miller DP, Benza RL, Meltzer LA, McGoon MD. Evaluation of the predictive value of a clinical worsening definition using 2-year outcomes in patients with pulmonary arterial hypertension: a REVEAL registry analysis. Chest 2013; 144(5):1521–1529. doi:10.1378/chest.12-3023
- Galiè N, Barberà JA, Frost AE, et al; AMBITION Investigators. Initial use of ambrisentan plus tadalafil in pulmonary arterial hypertension. N Engl J Med 2015; 373(9):834–844. doi:10.1056/NEJMoa1413687
- Farr G, Shah K, Markley R, Abbate A, Salloum FN, Grinnan D. Development of pulmonary hypertension in heart failure with preserved ejection fraction. Prog Cardiovasc Dis 2016; 59(1):52–58. doi:10.1016/j.pcad.2016.06.002
- Hoeper MM, Barberà JA, Channick RN, et al. Diagnosis, assessment, and treatment of non-pulmonary arterial hypertension pulmonary hypertension. J Am Coll Cardiol 2009; 54(suppl 1):S85–S96. doi:10.1016/j.jacc.2009.04.008
- Chaouat A, Naeije R, Weitzenblum E. Pulmonary hypertension in COPD. Eur Respir J 2008; 32(5):1371–1385. doi:10.1183/09031936.00015608
- Minai OA, Ricaurte B, Kaw R, et al. Frequency and impact of pulmonary hypertension in patients with obstructive sleep apnea syndrome. Am J Cardiol 2009; 104(9):1300–1306. doi:10.1016/j.amjcard.2009.06.048
- Kholdani C, Fares WH, Mohsenin V. Pulmonary hypertension in obstructive sleep apnea: is it clinically significant? A critical analysis of the association and pathophysiology. Pulm Circ 2015; 5(2):220–227. doi:10.1086/679995
- Prisco DL, Sica AL, Talwar A, et al. Correlation of pulmonary hypertension severity with metrics of comorbid sleep-disordered breathing. Sleep Breath 2011; 15(4):633–639. doi:10.1007/s11325-010-0411-y
- Dumitrascu R, Tiede H, Eckermann J, et al. Sleep apnea in precapillary pulmonary hypertension. Sleep Med 2013; 14(3):247–251. doi:10.1016/j.sleep.2012.11.013
- Arcasoy SM, Christie JD, Ferrari VA, et al. Echocardiographic assessment of pulmonary hypertension in patients with advanced lung disease. Am J Respir Crit Care Med 2003; 167(5):735–740. doi:10.1164/rccm.200210-1130OC
- Pepke-Zaba J, Jansa P, Kim NH, Naeije R, Simonneau G. Chronic thromboembolic pulmonary hypertension: role of medical therapy. Eur Respir J 2013; 41(4):985–990. doi:10.1183/09031936.00201612
- Guérin L, Couturaud F, Parent F, et al. Prevalence of chronic thromboembolic pulmonary hypertension after acute pulmonary embolism. Prevalence of CTEPH after pulmonary embolism. Thromb Haemost 2014; 112(3):598–605. doi:10.1160/TH13-07-0538
- Lang IM, Pesavento R, Bonderman D, Yuan JX. Risk factors and basic mechanisms of chronic thromboembolic pulmonary hypertension: a current understanding. Eur Respir J 2013; 41(2):462–468. doi:10.1183/09031936.00049312
- Pepke-Zaba J. Diagnostic testing to guide the management of chronic thromboembolic pulmonary hypertension: state of the art. Eur Respir Rev 2010; 19(115):55–58. doi:10.1183/09059180.00007209
- Bonderman D, Turecek PL, Jakowitsch J, et al. High prevalence of elevated clotting factor VIII in chronic thromboembolic pulmonary hypertension. Thromb Haemost 2003; 90(3):372–376. doi:10.1160/TH03-02-0067
- Pepke-Zaba J, Delcroix M, Lang I, et al. Chronic thromboembolic pulmonary hypertension (CTEPH): results from an international prospective registry. Circulation 2011; 124(18):1973–1981. doi:10.1161/CIRCULATIONAHA.110.015008
- Kim NH, Delcroix M, Jenkins DP, et al. Chronic thromboembolic pulmonary hypertension. J Am Coll Cardiol 2013; 62:(suppl 25):D92–D99. doi:10.1016/j.jacc.2013.10.024
- Moser KM, Auger WR, Fedullo PF. Chronic major-vessel thromboembolic pulmonary hypertension. Circulation 1990; 81(6):1735–1743. pmid:2188751
- McNeil K, Dunning J. Chronic thromboembolic pulmonary hypertension (CTEPH). Heart 2007; 93(9):1152–1158. doi:10.1136/hrt.2004.053603
- Tunariu N, Gibbs SJ, Win Z, et al. Ventilation-perfusion scintigraphy is more sensitive than multidetector CTPA in detecting chronic thromboembolic pulmonary disease as a treatable cause of pulmonary hypertension. J Nucl Med 2007; 48(5):680–684. doi:10.2967/jnumed.106.039438
- Fedullo P, Kerr KM, Kim NH, Auger WR. Chronic thromboembolic pulmonary hypertension. Am J Respir Crit Care Med 2011; 183(12):1605–1613. doi:10.1164/rccm.201011-1854CI
- Rich S, Kaufmann E, Levy PS. The effect of high doses of calcium-channel blockers on survival in primary pulmonary hypertension. N Engl J Med 1992; 327(2):76–81. doi:10.1056/NEJM199207093270203
- Sitbon O, Humbert M, Jaıs X, et al. Long-term response to calcium channel blockers in idiopathic pulmonary arterial hypertension. Circulation 2005; 111(23):3105–3111. doi:10.1161/CIRCULATIONAHA.104.488486
- Chin KM, Rubin LJ. Pulmonary arterial hypertension. J Am Coll Cardiol 2008; 51(16):1527–1538. doi:10.1016/j.jacc.2008.01.024
- Soubrier F, Chung WK, Machado R, et al. Genetics and genomics of pulmonary arterial hypertension. J Am Coll Cardiol 2013; 62(suppl 25):D13–D21. doi:10.1016/j.jacc.2013.10.035
- Eyries M, Montani D, Girerd B, et al. EIF2AK4 mutations cause pulmonary veno-occlusive disease, a recessive form of pulmonary hypertension. Nat Genet 2014; 46(1):65–69. doi: 10.1038/ng.2844
- Best DH, Sumner KL, Austin ED, et al. EIF2AK4 mutations in pulmonary capillary hemangiomatosis. Chest 2014; 145(2):231–236. doi:10.1378/chest.13-2366
- Best DH, Sumner KL, Smith BP, et al. EIF2AK4 mutations in patients diagnosed with pulmonary arterial hypertension. Chest 2017; 151(4):821–828. doi:10.1016/j.chest.2016.11.014
- Hadinnapola C, Bleda M, Haimel M, et al; NIHR BioResource–Rare Diseases Consortium; UK National Cohort Study of Idiopathic and Heritable PAH. Phenotypic characterization of EIF2AK4 mutation carriers in a large cohort of patients diagnosed clinically with pulmonary arterial hypertension. Circulation 2017; 136(21):2022–2033. doi:10.1161/CIRCULATIONAHA.117.028351
- Diaz-Guzman E, Farver C, Parambil J, Culver DA. Pulmonary hypertension caused by sarcoidosis. Clin Chest Med 2008; 29(3):549–563. doi:10.1016/j.ccm.2008.03.010
- Mauritz GJ, Kind T, Marcus JT, et al. Progressive changes in right ventricular geometric shortening and long-term survival in pulmonary arterial hypertension. Chest 2012; 141(4):935–943. doi:10.1378/chest.10-3277
- Galiè N, Palazzini M, Manes A. Pulmonary arterial hypertension: from the kingdom of the near-dead to multiple clinical trial meta-analyses. Eur Heart J 2010; 31(17):2080–2086. doi:10.1093/eurheartj/ehq152
KEY POINTS
- PAH has nonspecific symptoms, largely attributable to right ventricular dysfunction but seen in a host of other common cardiopulmonary ailments.
- In a patient suspected of having pulmonary hypertension, it is important to take a methodic diagnostic approach to identify underlying contributors and minimize unnecessary testing.
- Patients suspected of having PAH should be referred to a pulmonary hypertension center of excellence for evaluation and right heart catheterization.
- Once testing is complete, therapy and management should be guided both by data obtained during the initial evaluation and by factors with prognostic significance. This approach has changed PAH from a disease with a grim outlook to one in which appropriate evaluation and guidance can improve patient outcomes.
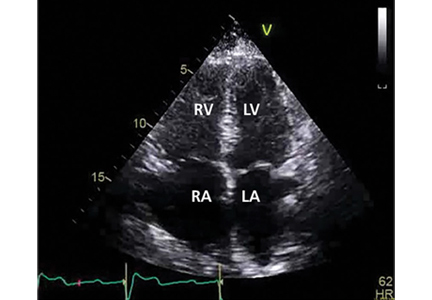
Finding the cause of acute kidney injury: Which index of fractional excretion is better?
An acute kidney injury can result from a myriad of causes and pathogenic pathways. Of these, the two main categories are prerenal causes (eg, heart failure, volume depletion) and causes that are intrinsic to the kidney (eg, acute tubular necrosis). Together, these categories account for more than 70% of all cases.1–3
While early intervention improves outcomes in both of these categories, the physician in the acute care setting must quickly distinguish between them, as their treatments differ. Similar clinical presentations along with confounding laboratory values make this distinction difficult. Furthermore, prolonged prerenal azotemia can eventually lead to acute tubular necrosis.
Therefore, several methods for distinguishing prerenal from intrinsic causes of acute kidney injury have been developed, including urinalysis, response to fluid challenge, the blood urea nitrogen-to-plasma creatinine ratio, levels of various urine electrolytes and biomarkers, and, the topics of our discussion here, the fractional excretion of sodium (FENa) and the fractional excretion of urea (FEU).4 While each method offers a unique picture of renal function, the validity of each may be affected by specific clinical factors.
In light of the frequent use of diuretics in inpatients and outpatients, a review of the utility of the FEU test is warranted. We will therefore present the theory behind the use of the FENa and the FEU for distinguishing intrinsic from prerenal causes of acute kidney injury, the relevant literature comparing the utility of these investigations, and our suggestions for clinical practice.
ACUTE KIDNEY INJURY DEFINED
Acute kidney injury (formerly called acute renal failure) describes an abrupt decline in renal function. Consensus definitions of it have been published and are gaining more widespread acceptance and use.9,10 The current definition is10:
- An absolute increase in serum creatinine ≥ 0.3 mg/dL (26.4 μmol/L) in 48 hours, or
- A percentage increase in serum creatinine ≥ 50% in 48 hours, or
- Urine output < 0.5 mL/kg/hour for > 6 hours.
These clear criteria allow for earlier recognition and treatment of this condition.
Acute kidney injury is fairly common in hospitalized patients, with 172 to 620 cases per million patients per year.11–14 Furthermore, hospitalized patients with acute kidney injury continue to have high rates of morbidity and death, especially those with more severe cases, in which the mortality rate remains as high as 40%.15
FRACTIONAL EXCRETION OF SODIUM
The FENa is a measure of the extraction of sodium and water from the glomerular filtrate. It is the ratio of the rate of sodium filtration (the urinary sodium concentration times the urinary flow rate, divided by the plasma sodium concentration) to the overall glomerular filtration rate, estimated by the renal filtration of creatinine. It can be calculated as the ratio of plasma creatinine to urine creatinine divided by the ratio of plasma sodium to urine sodium:
A euvolemic person with normal renal function and moderate salt intake in a steady state will have an FENa of approximately 1%.16
In 1976, Espinel17 originally showed that the FENa could be used during the oliguric phase in patients in acute renal failure to differentiate between prerenal acute kidney injury and acute tubular necrosis. Given the kidney’s ability to reabsorb more sodium during times of volume depletion, Espinel suggested that an FENa of less than 1% reflected normal sodium retention, indicating a prerenal cause, ie, diminished effective circulating volume. A value greater than 3% likely represented tubular damage, indicating that the nephrons were unable to properly reabsorb sodium.
The clinical utility of this index was apparent, as the management of prerenal azotemia and acute tubular necrosis differ.18 While both require fluid repletion, the risk of volume overload in acute tubular necrosis is high. Furthermore, acute tubular necrosis secondary to nephrotoxins could require hemodialysis to facilitate clearance of the offending agent.
The FENa test was subsequently validated in a number of studies in different populations and is still widely used.19–21
Limitations to the use of the FENa have been noted in various clinical settings. Notably, it can be falsely depressed in a number of intrinsic renal conditions, such as contrast-induced nephropathy, rhabdomyolysis, and acute glomerulonephritis. Conversely, patients with prerenal acute kidney injury who take diuretics can have a falsely elevated value due to the pharmacologically induced renal excretion of sodium independent of volume status. This is commonly seen in patients on diuretic therapy with baseline low effective circulating volumes, such those with congestive heart failure and hepatic cirrhosis.
FRACTIONAL EXCRETION OF UREA
Urea is continuously produced in the liver as the end product of protein metabolism. It is a small, water-soluble molecule that freely passes across cell membranes and is therefore continuously filtered and excreted by the kidneys. Not merely a waste product, urea is also important in water balance and constitutes approximately half of the normal solute content of urine.22
Urea’s excretion mechanisms are well characterized.22,23 It is absorbed in the proximal tubule, the medullary loop of Henle, and the medullary collecting ducts via facilitated diffusion through specific urea transporters.24 After being absorbed in the loop of Henle, urea is resecreted, a process that creates an osmotic gradient along the medulla that ultimately regulates urea excretion and reabsorption in the medullary collecting duct. Low-volume states are associated with decreased urea excretion due to a physiologic increase in antidiuretic hormone secretion, and the reverse is true for high-volume states.
The FEU has been recognized as a clinically useful tool. The correlation between serum and urine urea concentrations was investigated as early as 1904.25 However, most studies during the ensuing century focused on the serum urea concentration or the creatinine-to-urea ratio as a measure of glomerular failure.26–28 In 1992, Kaplan and Kohn29 proposed that the FEU could be a useful measure for assessing renal dysfunction in acute kidney injury. Conceptually similar to the FENa, the FEU is calculated as:
An FEU less than 35% suggests a prerenal cause of acute kidney injury, while a value greater than 50% suggests an intrinsic one.
FRACTIONAL EXCRETION OF UREA VS FRACTIONAL EXCRETION OF SODIUM
Kaplan and Kohn (1992)
Kaplan and Kohn,29 in their 1992 study, retrospectively analyzed 87 urine samples from 40 patients with renal dysfunction (not specifically acute kidney injury) thought to be secondary to volume depletion in which the FENa was discordant with the FEU.
Findings. Thirty-nine of the 40 patients treated with diuretics had a high FENa value. However, the FEU was low in all of these patients, leading the authors to conclude that the latter may be the more useful of the two indices in evaluating patients receiving diuretics who present with symptoms that suggest prerenal azotemia.
Limitations of the study. On closer inspection, these findings were not generalizable, for several reasons. First, the time that elapsed between administration of diuretics and evaluation of urinary electrolytes varied widely. Additionally, the study was a retrospective analysis of isolated urine specimens without clear correlation to a clinical patient or context. For these reasons, prospective analyses to investigate the utility of the fractional excretion of urea needed to be conducted.
Carvounis et al (2002)
Carvounis et al30 prospectively evaluated the FENa and the FEU in 102 consecutive intensive care patients with acute kidney injury (defined as a serum creatinine concentration > 1.5 mg/dL or an increase of more than 0.5 mg/dL in less than 48 hours). Oliguria was not an inclusion criterion for the study, but patients with acute glomerulonephritis and obstructive nephropathy were excluded. The study grouped subjects into those with prerenal azotemia, prerenal azotemia plus diuretic use, or acute tubular necrosis on the basis of the clinical diagnosis of the attending nephrologist.
Findings. The FEU was more sensitive than the FENa in detecting prerenal azotemia, especially in those with prerenal azotemia who were receiving diuretics. Overall, the FEU had higher sensitivity and specificity for prerenal azotemia regardless of diuretic usage, and more importantly, the best overall positive and negative predictive value for detecting it (99% and 75% respectively).
These results indicate that, in patients given diuretics, the FENa fails to discriminate between prerenal azotemia and acute tubular necrosis. Conversely, the FEU was excellent in discriminating between all cases of prerenal azotemia and acute tubular necrosis irrespective of the use of diuretics. This has significant practical application, given the frequency of diuretic use in the hospital, particularly in intensive care patients.
Limitations of the study. While the findings supported the utility of the FEU, the study population was limited to intensive care patients. Furthermore, the authors did not report the statistical significance of their findings.30
Pépin et al (2007)
Pépin et al8 performed a similar study, investigating the diagnostic utility of the FENa and the FEU in patients with acute kidney injury, with or without diuretic therapy.
The authors prospectively studied 99 consecutive patients confirmed by an independent nephrologist to have acute kidney injury (defined as an increase in serum creatinine of more than 30% over baseline values within less than 1 week) due to either volume depletion or ischemia. They excluded patients with less common causes of acute kidney injury, such as rhabdomyolysis, obstructive nephropathy, adrenal insufficiency, acute glomerulonephritis, and nephrotoxic acute kidney injury, as well as patients with chronic kidney disease.
Patients were grouped into those with transient acute kidney injury (from decreased kidney perfusion) and persistent acute kidney injury (attributed to acute tubular necrosis), with or without diuretic therapy, according to predefined clinical criteria. They were considered to have diuretic exposure if they had received furosemide (Lasix) within 24 hours or a thiazide within 48 hours of sampling.
Findings. The FENa proved superior to the FEU in patients not taking diuretics and, contrary to the findings of Carvounis et al,30 exhibited diagnostic utility in patients taking diuretics as well. Neither index discriminated between the different etiologies exceptionally well, however.
Of note, the study population was more inclusive than in previous studies, with only 63 intensive care patients, thus making the results more generalizable to all cases of inpatient acute kidney injury. Furthermore, the study included patients with and without oliguria, and the sensitivity and specificity of both the FENa and the FEU were higher in the nonoliguric group (n = 25).
Limitations of the study. The authors admit that a long time may have elapsed between diuretic administration and urine measurements, thereby mitigating the diuretic’s natriuretic effect independent of the patient’s volume status. While this variable may account for the better performance of the FENa than in the other studies, it does not account for the poor performance of the FEU.
Additionally, few of the findings reached statistical significance.
Lastly, a high percentage (30%) of patients had sepsis. The FEU is less effective in patients with infection, as cytokines interfere with the urea transporters in the kidney and colon.31
Lim et al (2009)
Lim et al32 conducted a study similar in design to that of Pépin et al.8
Findings. The FEU was as clinically useful as the FENa at distinguishing transient from persistent acute kidney injury in patients on diuretics. Using a cutoff FEU of less than 30% and a cutoff FENa of less than 1.5% for transient acute kidney injury (based on calculated receiver operating characteristic curves), FENa was more sensitive and specific than FEU in the nondiuretic groups. In patients exposed to diuretics, FEU was more sensitive but less specific than FENa.
FRACTIONAL EXCRETION OF UREA IN OLIGURIA
Diskin et al (2010)
In 2010, Diskin et al33 published a prospective, observational study of 100 consecutive patients with oliguric azotemia referred to a nephrology service. They defined acute kidney injury as serum creatinine concentration greater than 1.9 mg/dL and urine output less than 100 mL in 24 hours. They used a higher FEU cutoff for prerenal azotemia of less than 40% to reflect the known urea secretion rate in oliguric patients (600 mL/24 hours). They used an FENa of less than 1% and greater than 3% to distinguish prerenal azotemia from acute tubular necrosis.
Findings. The FEU was more accurate than the FENa, giving the right diagnosis in 95% vs 54% of cases (P < .0001). The difference was exclusively due to the FEU’s greater utility in the 67 patients who had received diuretics (98% vs 49%, P < .0001). Both the FEU and the FENa accurately detected acute tubular necrosis. As expected, the FENa outperformed FEU in the setting of infection, in which cytokine stimulation interferes with urea excretion.
Limitations of the study. Approximately 80% of the patients had prerenal azotemia, potentially biasing the results toward a test geared toward detecting this condition. However, since prerenal causes are more common than intrinsic causes, the authors argued that their cohort more accurately reflected the population encountered in clinical practice.
Additionally, only patients with oliguria and more advanced kidney injury (serum creatinine > 1.9 mg/dL) were included in the study, potentially limiting the applicability of these results in patients with preserved urine output in the early stages of renal failure.
Table 2 summarizes the findings of the studies discussed above.8,15,30,32,33
FRACTIONAL EXCRETION OF UREA IN CHILDREN AND THE ELDERLY
The FEU has also been validated in populations at the extremes of age.
In children, Fahimi et al34 performed a cross-sectional study in 43 patients referred to a nephrology service because of acute kidney injury.
An FEU less than 35% had greater sensitivity and specificity than an FENa less than 1% for differentiating prerenal from intrinsic causes in pediatric populations. An FEU of less than 30% had an even greater power of distinguishing between the two. Interestingly, 15 of the 26 patients in the group with prerenal azotemia had an FENa greater than 1%, 8 of whom had an obvious cause (diuretic therapy in 5, salt-losing congenital adrenal hyperplasia in 2, and metabolic alkalosis in 1).
In elderly people, urinary indices are less reliable because of reduced sodium and urea reabsorption and urinary concentrating capability. Thus, the FENa and FEU are increased, making the standard cutoff values unreliable and unpredictable for distinguishing prerenal from intrinsic causes of acute kidney injury.35
WHICH TEST SHOULD BE USED?
Both the FENa and the FEU have been validated in prospective trials as useful clinical indices in identifying prerenal azotemia. Results of these studies vary as to which index is superior and when. This may be attributable to the various definitions of acute kidney injury and diagnostic criteria used in the studies as well as the heterogeneity of patients in each study.
However, the preponderance of evidence indicates that the FEU is more useful than the FENa in patients on diuretics. Since diuretics are widely used, particularly in acute care settings in which acute kidney injury is prevalent, the FEU is a useful clinical tool and should be utilized in this context accordingly. Specifically, when there is a history of recent diuretic use, the evidence supports ordering the FEU alone, or at least in conjunction with the FENa. If the two indices yield disparate results, the physician should look for circumstances that would alter each one of them, such as sepsis or an unrecognized dose of diuretic.
In managing acute kidney injury, distinguishing prerenal from intrinsic causes is a difficult task, particularly because prolonged prerenal azotemia can develop into acute tubular necrosis. Therefore, a single index, calculated at a specific time, often is insufficient to properly characterize the pathogenesis of acute kidney injury, and a combination of both of these indices may increase diagnostic sensitivity and specificity.36 Moreover, urine samples collected after acute changes in volume or osmolarity, such as blood loss, administration of intravenous fluids or parenteral nutrition, or dialysis may compromise their diagnostic utility, and care must be taken to interpret the results in the appropriate clinical context.
The clinician must be aware of both the respective applications and limitations of these indices when using them to guide management and navigate the differential diagnosis in the appropriate clinical settings.
- Nolan CR, Anderson RJ. Hospital-acquired acute renal failure. J Am Soc Nephrol 1998; 9:710–718.
- Mehta RL, Pascual MT, Soroko S, et al; Program to Improve Care in Acute Renal Disease. Spectrum of acute renal failure in the intensive care unit: the PICARD experience. Kidney Int 2004; 66:1613–1621.
- Myers BD, Miller DC, Mehigan JT, et al. Nature of the renal injury following total renal ischemia in man. J Clin Invest 1984; 73:329–341.
- Ho E, Fard A, Maisel A. Evolving use of biomarkers for kidney injury in acute care settings. Curr Opin Crit Care 2010; 16:399–407.
- Steiner RW. Low fractional excretion of sodium in myoglobinuric acute renal failure. Arch Intern Med 1982; 142:1216–1217.
- Vaz AJ. Low fractional excretion of urine sodium in acute renal failure due to sepsis. Arch Intern Med 1983; 143:738–739.
- Pru C, Kjellstrand CM. The FENa test is of no prognostic value in acute renal failure. Nephron 1984; 36:20–23.
- Pépin MN, Bouchard J, Legault L, Ethier J. Diagnostic performance of fractional excretion of urea and fractional excretion of sodium in the evaluations of patients with acute kidney injury with or without diuretic treatment. Am J Kidney Dis 2007; 50:566–573.
- Bellomo R, Ronco C, Kellum JA, Mehta RL, Palevsky P; Acute Dialysis Quality Initiative workgroup. Acute renal failure—definition, outcome measures, animal models, fluid therapy and information technology needs: the Second International Consensus Conference of the Acute Dialysis Quality Initiative (ADQI) Group. Crit Care 2004; 8:R204–R212.
- Mehta RL, Kellum JA, Shah SV, et al; Acute Kidney Injury Network. Acute Kidney Injury Network: report of an initiative to improve outcomes in acute kidney injury. Crit Care 2007; 11:R31.
- Stevens PE, Tamimi NA, Al-Hasani MK, et al. Non-specialist management of acute renal failure. QJM 2001; 94:533–540.
- Feest TG, Round A, Hamad S. Incidence of severe acute renal failure in adults: results of a community based study. BMJ 1993; 306:481–483.
- Liaño F, Pascual J. Epidemiology of acute renal failure: a prospective, multicenter, community-based study. Madrid Acute Renal Failure Study Group. Kidney Int 1996; 50:811–818.
- Thadhani R, Pascual M, Bonventre JV. Acute renal failure. N Engl J Med 1996; 334:1448–1460.
- Bagshaw SM, George C, Bellomo R; ANZICS Database Management Committee. Changes in the incidence and outcome for early acute kidney injury in a cohort of Australian intensive care units. Crit Care 2007; 11:R68.
- Sodium homeostasis in chronic renal disease. Kidney Int 1982; 21:886–897.
- Espinel CH. The FENa test. Use in the differential diagnosis of acute renal failure. JAMA 1976; 236:579–581.
- Schrier RW, Wang W, Poole B, Mitra A. Acute renal failure: definitions, diagnosis, pathogenesis, and therapy. J Clin Invest 2004; 114:5–14.
- Miller TR, Anderson RJ, Linas SL, et al. Urinary diagnostic indices in acute renal failure: a prospective study. Ann Intern Med 1978; 89:47–50.
- Zarich S, Fang LS, Diamond JR. Fractional excretion of sodium. Exceptions to its diagnostic value. Arch Intern Med 1985; 145:108–112.
- Mandal AK, Baig M, Koutoubi Z. Management of acute renal failure in the elderly. Treatment options. Drugs Aging 1996; 9:226–250.
- Sands JM. Critical role of urea in the urine-concentrating mechanism. J Am Soc Nephrol 2007; 18:670–671.
- Goldstein MH, Lenz PR, Levitt MF. Effect of urine flow rate on urea reabsorption in man: urea as a “tubular marker”. J Appl Physiol 1969; 26:594–599.
- Fenton RA, Knepper MA. Urea and renal function in the 21st century: insights from knockout mice. J Am Soc Nephrol 2007; 18:679–688.
- Gréhant N. Physiologique des reins par le dosage de l’urée dans le sang et dans l’urine. J Physiol Pathol Gen (Paris) 1904; 6:1–8.
- Dossetor JB. Creatininemia versus uremia. The relative significance of blood urea nitrogen and serum creatinine concentrations in azotemia. Ann Intern Med 1966; 65:1287–1299.
- Kahn S, Sagel J, Eales L, Rabkin R. The significance of serum creatinine and the blood urea-serum creatinine ratio in azotaemia. S Afr Med J 1972; 46:1828–1832.
- Kerr DNS, Davison JM. The assessment of renal function. Br J Hosp Med 1975; 14:360–372.
- Kaplan AA, Kohn OF. Fractional excretion of urea as a guide to renal dysfunction. Am J Nephrol 1992; 12:49–54.
- Carvounis CP, Nisar S, Guro-Razuman S. Significance of the fractional excretion of urea in the differential diagnosis of acute renal failure. Kidney Int 2002; 62:2223–2229.
- Schmidt C, Höcherl K, Bucher M. Cytokine-mediated regulation of urea transporters during experimental endotoxemia. Am J Physiol Renal Physiol 2007; 292:F1479–F1489.
- Lim DH, Jeong JM, Oh SH, et al. Diagnostic performance of fractional excretion of urea in evaluating patients with acute kidney injury with diuretics treatment. Korean J Nephrol 2009; 28:190–198.
- Diskin CJ, Stokes TJ, Dansby LM, Radcliff L, Carter TB. The comparative benefits of the fractional excretion of urea and sodium in various azotemic oliguric states. Nephron Clin Pract 2010; 114:c145–c150.
- Fahimi D, Mohajeri S, Hajizadeh N, et al. Comparison between fractional excretions of urea and sodium in children with acute kidney injury. Pediatr Nephrol 2009; 24:2409–2412.
- Musso CG, Liakopoulos V, Ioannidis I, Eleftheriadis T, Stefanidis I. Acute renal failure in the elderly: particular characteristics. Int Urol Nephrol 2006; 38:787–793.
- Schönermarck U, Kehl K, Samtleben W. Diagnostic performance of fractional excretion of urea and sodium in acute kidney injury. Am J Kidney Dis 2008; 51:870–871.
An acute kidney injury can result from a myriad of causes and pathogenic pathways. Of these, the two main categories are prerenal causes (eg, heart failure, volume depletion) and causes that are intrinsic to the kidney (eg, acute tubular necrosis). Together, these categories account for more than 70% of all cases.1–3
While early intervention improves outcomes in both of these categories, the physician in the acute care setting must quickly distinguish between them, as their treatments differ. Similar clinical presentations along with confounding laboratory values make this distinction difficult. Furthermore, prolonged prerenal azotemia can eventually lead to acute tubular necrosis.
Therefore, several methods for distinguishing prerenal from intrinsic causes of acute kidney injury have been developed, including urinalysis, response to fluid challenge, the blood urea nitrogen-to-plasma creatinine ratio, levels of various urine electrolytes and biomarkers, and, the topics of our discussion here, the fractional excretion of sodium (FENa) and the fractional excretion of urea (FEU).4 While each method offers a unique picture of renal function, the validity of each may be affected by specific clinical factors.
In light of the frequent use of diuretics in inpatients and outpatients, a review of the utility of the FEU test is warranted. We will therefore present the theory behind the use of the FENa and the FEU for distinguishing intrinsic from prerenal causes of acute kidney injury, the relevant literature comparing the utility of these investigations, and our suggestions for clinical practice.
ACUTE KIDNEY INJURY DEFINED
Acute kidney injury (formerly called acute renal failure) describes an abrupt decline in renal function. Consensus definitions of it have been published and are gaining more widespread acceptance and use.9,10 The current definition is10:
- An absolute increase in serum creatinine ≥ 0.3 mg/dL (26.4 μmol/L) in 48 hours, or
- A percentage increase in serum creatinine ≥ 50% in 48 hours, or
- Urine output < 0.5 mL/kg/hour for > 6 hours.
These clear criteria allow for earlier recognition and treatment of this condition.
Acute kidney injury is fairly common in hospitalized patients, with 172 to 620 cases per million patients per year.11–14 Furthermore, hospitalized patients with acute kidney injury continue to have high rates of morbidity and death, especially those with more severe cases, in which the mortality rate remains as high as 40%.15
FRACTIONAL EXCRETION OF SODIUM
The FENa is a measure of the extraction of sodium and water from the glomerular filtrate. It is the ratio of the rate of sodium filtration (the urinary sodium concentration times the urinary flow rate, divided by the plasma sodium concentration) to the overall glomerular filtration rate, estimated by the renal filtration of creatinine. It can be calculated as the ratio of plasma creatinine to urine creatinine divided by the ratio of plasma sodium to urine sodium:
A euvolemic person with normal renal function and moderate salt intake in a steady state will have an FENa of approximately 1%.16
In 1976, Espinel17 originally showed that the FENa could be used during the oliguric phase in patients in acute renal failure to differentiate between prerenal acute kidney injury and acute tubular necrosis. Given the kidney’s ability to reabsorb more sodium during times of volume depletion, Espinel suggested that an FENa of less than 1% reflected normal sodium retention, indicating a prerenal cause, ie, diminished effective circulating volume. A value greater than 3% likely represented tubular damage, indicating that the nephrons were unable to properly reabsorb sodium.
The clinical utility of this index was apparent, as the management of prerenal azotemia and acute tubular necrosis differ.18 While both require fluid repletion, the risk of volume overload in acute tubular necrosis is high. Furthermore, acute tubular necrosis secondary to nephrotoxins could require hemodialysis to facilitate clearance of the offending agent.
The FENa test was subsequently validated in a number of studies in different populations and is still widely used.19–21
Limitations to the use of the FENa have been noted in various clinical settings. Notably, it can be falsely depressed in a number of intrinsic renal conditions, such as contrast-induced nephropathy, rhabdomyolysis, and acute glomerulonephritis. Conversely, patients with prerenal acute kidney injury who take diuretics can have a falsely elevated value due to the pharmacologically induced renal excretion of sodium independent of volume status. This is commonly seen in patients on diuretic therapy with baseline low effective circulating volumes, such those with congestive heart failure and hepatic cirrhosis.
FRACTIONAL EXCRETION OF UREA
Urea is continuously produced in the liver as the end product of protein metabolism. It is a small, water-soluble molecule that freely passes across cell membranes and is therefore continuously filtered and excreted by the kidneys. Not merely a waste product, urea is also important in water balance and constitutes approximately half of the normal solute content of urine.22
Urea’s excretion mechanisms are well characterized.22,23 It is absorbed in the proximal tubule, the medullary loop of Henle, and the medullary collecting ducts via facilitated diffusion through specific urea transporters.24 After being absorbed in the loop of Henle, urea is resecreted, a process that creates an osmotic gradient along the medulla that ultimately regulates urea excretion and reabsorption in the medullary collecting duct. Low-volume states are associated with decreased urea excretion due to a physiologic increase in antidiuretic hormone secretion, and the reverse is true for high-volume states.
The FEU has been recognized as a clinically useful tool. The correlation between serum and urine urea concentrations was investigated as early as 1904.25 However, most studies during the ensuing century focused on the serum urea concentration or the creatinine-to-urea ratio as a measure of glomerular failure.26–28 In 1992, Kaplan and Kohn29 proposed that the FEU could be a useful measure for assessing renal dysfunction in acute kidney injury. Conceptually similar to the FENa, the FEU is calculated as:
An FEU less than 35% suggests a prerenal cause of acute kidney injury, while a value greater than 50% suggests an intrinsic one.
FRACTIONAL EXCRETION OF UREA VS FRACTIONAL EXCRETION OF SODIUM
Kaplan and Kohn (1992)
Kaplan and Kohn,29 in their 1992 study, retrospectively analyzed 87 urine samples from 40 patients with renal dysfunction (not specifically acute kidney injury) thought to be secondary to volume depletion in which the FENa was discordant with the FEU.
Findings. Thirty-nine of the 40 patients treated with diuretics had a high FENa value. However, the FEU was low in all of these patients, leading the authors to conclude that the latter may be the more useful of the two indices in evaluating patients receiving diuretics who present with symptoms that suggest prerenal azotemia.
Limitations of the study. On closer inspection, these findings were not generalizable, for several reasons. First, the time that elapsed between administration of diuretics and evaluation of urinary electrolytes varied widely. Additionally, the study was a retrospective analysis of isolated urine specimens without clear correlation to a clinical patient or context. For these reasons, prospective analyses to investigate the utility of the fractional excretion of urea needed to be conducted.
Carvounis et al (2002)
Carvounis et al30 prospectively evaluated the FENa and the FEU in 102 consecutive intensive care patients with acute kidney injury (defined as a serum creatinine concentration > 1.5 mg/dL or an increase of more than 0.5 mg/dL in less than 48 hours). Oliguria was not an inclusion criterion for the study, but patients with acute glomerulonephritis and obstructive nephropathy were excluded. The study grouped subjects into those with prerenal azotemia, prerenal azotemia plus diuretic use, or acute tubular necrosis on the basis of the clinical diagnosis of the attending nephrologist.
Findings. The FEU was more sensitive than the FENa in detecting prerenal azotemia, especially in those with prerenal azotemia who were receiving diuretics. Overall, the FEU had higher sensitivity and specificity for prerenal azotemia regardless of diuretic usage, and more importantly, the best overall positive and negative predictive value for detecting it (99% and 75% respectively).
These results indicate that, in patients given diuretics, the FENa fails to discriminate between prerenal azotemia and acute tubular necrosis. Conversely, the FEU was excellent in discriminating between all cases of prerenal azotemia and acute tubular necrosis irrespective of the use of diuretics. This has significant practical application, given the frequency of diuretic use in the hospital, particularly in intensive care patients.
Limitations of the study. While the findings supported the utility of the FEU, the study population was limited to intensive care patients. Furthermore, the authors did not report the statistical significance of their findings.30
Pépin et al (2007)
Pépin et al8 performed a similar study, investigating the diagnostic utility of the FENa and the FEU in patients with acute kidney injury, with or without diuretic therapy.
The authors prospectively studied 99 consecutive patients confirmed by an independent nephrologist to have acute kidney injury (defined as an increase in serum creatinine of more than 30% over baseline values within less than 1 week) due to either volume depletion or ischemia. They excluded patients with less common causes of acute kidney injury, such as rhabdomyolysis, obstructive nephropathy, adrenal insufficiency, acute glomerulonephritis, and nephrotoxic acute kidney injury, as well as patients with chronic kidney disease.
Patients were grouped into those with transient acute kidney injury (from decreased kidney perfusion) and persistent acute kidney injury (attributed to acute tubular necrosis), with or without diuretic therapy, according to predefined clinical criteria. They were considered to have diuretic exposure if they had received furosemide (Lasix) within 24 hours or a thiazide within 48 hours of sampling.
Findings. The FENa proved superior to the FEU in patients not taking diuretics and, contrary to the findings of Carvounis et al,30 exhibited diagnostic utility in patients taking diuretics as well. Neither index discriminated between the different etiologies exceptionally well, however.
Of note, the study population was more inclusive than in previous studies, with only 63 intensive care patients, thus making the results more generalizable to all cases of inpatient acute kidney injury. Furthermore, the study included patients with and without oliguria, and the sensitivity and specificity of both the FENa and the FEU were higher in the nonoliguric group (n = 25).
Limitations of the study. The authors admit that a long time may have elapsed between diuretic administration and urine measurements, thereby mitigating the diuretic’s natriuretic effect independent of the patient’s volume status. While this variable may account for the better performance of the FENa than in the other studies, it does not account for the poor performance of the FEU.
Additionally, few of the findings reached statistical significance.
Lastly, a high percentage (30%) of patients had sepsis. The FEU is less effective in patients with infection, as cytokines interfere with the urea transporters in the kidney and colon.31
Lim et al (2009)
Lim et al32 conducted a study similar in design to that of Pépin et al.8
Findings. The FEU was as clinically useful as the FENa at distinguishing transient from persistent acute kidney injury in patients on diuretics. Using a cutoff FEU of less than 30% and a cutoff FENa of less than 1.5% for transient acute kidney injury (based on calculated receiver operating characteristic curves), FENa was more sensitive and specific than FEU in the nondiuretic groups. In patients exposed to diuretics, FEU was more sensitive but less specific than FENa.
FRACTIONAL EXCRETION OF UREA IN OLIGURIA
Diskin et al (2010)
In 2010, Diskin et al33 published a prospective, observational study of 100 consecutive patients with oliguric azotemia referred to a nephrology service. They defined acute kidney injury as serum creatinine concentration greater than 1.9 mg/dL and urine output less than 100 mL in 24 hours. They used a higher FEU cutoff for prerenal azotemia of less than 40% to reflect the known urea secretion rate in oliguric patients (600 mL/24 hours). They used an FENa of less than 1% and greater than 3% to distinguish prerenal azotemia from acute tubular necrosis.
Findings. The FEU was more accurate than the FENa, giving the right diagnosis in 95% vs 54% of cases (P < .0001). The difference was exclusively due to the FEU’s greater utility in the 67 patients who had received diuretics (98% vs 49%, P < .0001). Both the FEU and the FENa accurately detected acute tubular necrosis. As expected, the FENa outperformed FEU in the setting of infection, in which cytokine stimulation interferes with urea excretion.
Limitations of the study. Approximately 80% of the patients had prerenal azotemia, potentially biasing the results toward a test geared toward detecting this condition. However, since prerenal causes are more common than intrinsic causes, the authors argued that their cohort more accurately reflected the population encountered in clinical practice.
Additionally, only patients with oliguria and more advanced kidney injury (serum creatinine > 1.9 mg/dL) were included in the study, potentially limiting the applicability of these results in patients with preserved urine output in the early stages of renal failure.
Table 2 summarizes the findings of the studies discussed above.8,15,30,32,33
FRACTIONAL EXCRETION OF UREA IN CHILDREN AND THE ELDERLY
The FEU has also been validated in populations at the extremes of age.
In children, Fahimi et al34 performed a cross-sectional study in 43 patients referred to a nephrology service because of acute kidney injury.
An FEU less than 35% had greater sensitivity and specificity than an FENa less than 1% for differentiating prerenal from intrinsic causes in pediatric populations. An FEU of less than 30% had an even greater power of distinguishing between the two. Interestingly, 15 of the 26 patients in the group with prerenal azotemia had an FENa greater than 1%, 8 of whom had an obvious cause (diuretic therapy in 5, salt-losing congenital adrenal hyperplasia in 2, and metabolic alkalosis in 1).
In elderly people, urinary indices are less reliable because of reduced sodium and urea reabsorption and urinary concentrating capability. Thus, the FENa and FEU are increased, making the standard cutoff values unreliable and unpredictable for distinguishing prerenal from intrinsic causes of acute kidney injury.35
WHICH TEST SHOULD BE USED?
Both the FENa and the FEU have been validated in prospective trials as useful clinical indices in identifying prerenal azotemia. Results of these studies vary as to which index is superior and when. This may be attributable to the various definitions of acute kidney injury and diagnostic criteria used in the studies as well as the heterogeneity of patients in each study.
However, the preponderance of evidence indicates that the FEU is more useful than the FENa in patients on diuretics. Since diuretics are widely used, particularly in acute care settings in which acute kidney injury is prevalent, the FEU is a useful clinical tool and should be utilized in this context accordingly. Specifically, when there is a history of recent diuretic use, the evidence supports ordering the FEU alone, or at least in conjunction with the FENa. If the two indices yield disparate results, the physician should look for circumstances that would alter each one of them, such as sepsis or an unrecognized dose of diuretic.
In managing acute kidney injury, distinguishing prerenal from intrinsic causes is a difficult task, particularly because prolonged prerenal azotemia can develop into acute tubular necrosis. Therefore, a single index, calculated at a specific time, often is insufficient to properly characterize the pathogenesis of acute kidney injury, and a combination of both of these indices may increase diagnostic sensitivity and specificity.36 Moreover, urine samples collected after acute changes in volume or osmolarity, such as blood loss, administration of intravenous fluids or parenteral nutrition, or dialysis may compromise their diagnostic utility, and care must be taken to interpret the results in the appropriate clinical context.
The clinician must be aware of both the respective applications and limitations of these indices when using them to guide management and navigate the differential diagnosis in the appropriate clinical settings.
- Nolan CR, Anderson RJ. Hospital-acquired acute renal failure. J Am Soc Nephrol 1998; 9:710–718.
- Mehta RL, Pascual MT, Soroko S, et al; Program to Improve Care in Acute Renal Disease. Spectrum of acute renal failure in the intensive care unit: the PICARD experience. Kidney Int 2004; 66:1613–1621.
- Myers BD, Miller DC, Mehigan JT, et al. Nature of the renal injury following total renal ischemia in man. J Clin Invest 1984; 73:329–341.
- Ho E, Fard A, Maisel A. Evolving use of biomarkers for kidney injury in acute care settings. Curr Opin Crit Care 2010; 16:399–407.
- Steiner RW. Low fractional excretion of sodium in myoglobinuric acute renal failure. Arch Intern Med 1982; 142:1216–1217.
- Vaz AJ. Low fractional excretion of urine sodium in acute renal failure due to sepsis. Arch Intern Med 1983; 143:738–739.
- Pru C, Kjellstrand CM. The FENa test is of no prognostic value in acute renal failure. Nephron 1984; 36:20–23.
- Pépin MN, Bouchard J, Legault L, Ethier J. Diagnostic performance of fractional excretion of urea and fractional excretion of sodium in the evaluations of patients with acute kidney injury with or without diuretic treatment. Am J Kidney Dis 2007; 50:566–573.
- Bellomo R, Ronco C, Kellum JA, Mehta RL, Palevsky P; Acute Dialysis Quality Initiative workgroup. Acute renal failure—definition, outcome measures, animal models, fluid therapy and information technology needs: the Second International Consensus Conference of the Acute Dialysis Quality Initiative (ADQI) Group. Crit Care 2004; 8:R204–R212.
- Mehta RL, Kellum JA, Shah SV, et al; Acute Kidney Injury Network. Acute Kidney Injury Network: report of an initiative to improve outcomes in acute kidney injury. Crit Care 2007; 11:R31.
- Stevens PE, Tamimi NA, Al-Hasani MK, et al. Non-specialist management of acute renal failure. QJM 2001; 94:533–540.
- Feest TG, Round A, Hamad S. Incidence of severe acute renal failure in adults: results of a community based study. BMJ 1993; 306:481–483.
- Liaño F, Pascual J. Epidemiology of acute renal failure: a prospective, multicenter, community-based study. Madrid Acute Renal Failure Study Group. Kidney Int 1996; 50:811–818.
- Thadhani R, Pascual M, Bonventre JV. Acute renal failure. N Engl J Med 1996; 334:1448–1460.
- Bagshaw SM, George C, Bellomo R; ANZICS Database Management Committee. Changes in the incidence and outcome for early acute kidney injury in a cohort of Australian intensive care units. Crit Care 2007; 11:R68.
- Sodium homeostasis in chronic renal disease. Kidney Int 1982; 21:886–897.
- Espinel CH. The FENa test. Use in the differential diagnosis of acute renal failure. JAMA 1976; 236:579–581.
- Schrier RW, Wang W, Poole B, Mitra A. Acute renal failure: definitions, diagnosis, pathogenesis, and therapy. J Clin Invest 2004; 114:5–14.
- Miller TR, Anderson RJ, Linas SL, et al. Urinary diagnostic indices in acute renal failure: a prospective study. Ann Intern Med 1978; 89:47–50.
- Zarich S, Fang LS, Diamond JR. Fractional excretion of sodium. Exceptions to its diagnostic value. Arch Intern Med 1985; 145:108–112.
- Mandal AK, Baig M, Koutoubi Z. Management of acute renal failure in the elderly. Treatment options. Drugs Aging 1996; 9:226–250.
- Sands JM. Critical role of urea in the urine-concentrating mechanism. J Am Soc Nephrol 2007; 18:670–671.
- Goldstein MH, Lenz PR, Levitt MF. Effect of urine flow rate on urea reabsorption in man: urea as a “tubular marker”. J Appl Physiol 1969; 26:594–599.
- Fenton RA, Knepper MA. Urea and renal function in the 21st century: insights from knockout mice. J Am Soc Nephrol 2007; 18:679–688.
- Gréhant N. Physiologique des reins par le dosage de l’urée dans le sang et dans l’urine. J Physiol Pathol Gen (Paris) 1904; 6:1–8.
- Dossetor JB. Creatininemia versus uremia. The relative significance of blood urea nitrogen and serum creatinine concentrations in azotemia. Ann Intern Med 1966; 65:1287–1299.
- Kahn S, Sagel J, Eales L, Rabkin R. The significance of serum creatinine and the blood urea-serum creatinine ratio in azotaemia. S Afr Med J 1972; 46:1828–1832.
- Kerr DNS, Davison JM. The assessment of renal function. Br J Hosp Med 1975; 14:360–372.
- Kaplan AA, Kohn OF. Fractional excretion of urea as a guide to renal dysfunction. Am J Nephrol 1992; 12:49–54.
- Carvounis CP, Nisar S, Guro-Razuman S. Significance of the fractional excretion of urea in the differential diagnosis of acute renal failure. Kidney Int 2002; 62:2223–2229.
- Schmidt C, Höcherl K, Bucher M. Cytokine-mediated regulation of urea transporters during experimental endotoxemia. Am J Physiol Renal Physiol 2007; 292:F1479–F1489.
- Lim DH, Jeong JM, Oh SH, et al. Diagnostic performance of fractional excretion of urea in evaluating patients with acute kidney injury with diuretics treatment. Korean J Nephrol 2009; 28:190–198.
- Diskin CJ, Stokes TJ, Dansby LM, Radcliff L, Carter TB. The comparative benefits of the fractional excretion of urea and sodium in various azotemic oliguric states. Nephron Clin Pract 2010; 114:c145–c150.
- Fahimi D, Mohajeri S, Hajizadeh N, et al. Comparison between fractional excretions of urea and sodium in children with acute kidney injury. Pediatr Nephrol 2009; 24:2409–2412.
- Musso CG, Liakopoulos V, Ioannidis I, Eleftheriadis T, Stefanidis I. Acute renal failure in the elderly: particular characteristics. Int Urol Nephrol 2006; 38:787–793.
- Schönermarck U, Kehl K, Samtleben W. Diagnostic performance of fractional excretion of urea and sodium in acute kidney injury. Am J Kidney Dis 2008; 51:870–871.
KEY POINTS
- Finding the cause of acute kidney injury is important, as management strategies differ.
- Although cutoff values differ among studies, in a patient with acute kidney injury, an FENa lower than 1% suggests a prerenal cause, whereas a value higher than 3% suggests an intrinsic cause.
- Similarly, an FEU less than 35% suggests a prerenal cause of acute kidney injury, whereas a value higher than 50% suggests an intrinsic one.
- The FENa can be falsely high in patients taking a diuretic; it can be falsely low in a number of intrinsic renal conditions, such as contrast-induced nephropathy, rhabdomyolysis, and acute glomerulonephritis.