User login
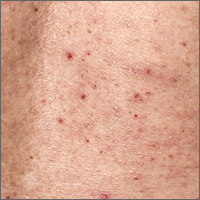
What is the most effective treatment for scabies?
EVIDENCE SUMMARY
A 2007 Cochrane review on scabies treatment identified 11 trials that evaluated permethrin for treating scabies.1 In 2 trials, 140 patients were randomized to receive either 200 mcg/kg of oral ivermectin or overnight application of 5% topical permethrin. Topical permethrin was superior to oral ivermectin with failure rates at 2 weeks of 8% and 39%, respectively (number needed to treat [NNT]=4; risk ratio [RR]=4.61; 95% confidence interval [CI], 2.07-10.26).
Two trials compared 5% topical permethrin with 10% topical crotamiton in 194 patients with follow-up at 28 days. Permethrin was superior to crotamiton with failure rates of 6% and 26%, respectively (NNT=6; RR=0.24; 95% CI, 0.10-0.55).
Five trials with 753 patients compared topical permethrin, 2.5% to 3.5%, with topical 1% lindane, but heterogeneity precluded pooling all the studies. In the 3 studies (554 patients) that were comparable, topical 3.5% permethrin was superior to lindane after a single application of each with failure rates of 9% and 15%, respectively (NNT=17; RR=0.59; 95% CI, 0.37-0.95).
Two trials that compared permethrin with topical benzyl benzoate (53 patients) and natural synergized pyrethrins (40 patients) showed no difference in treatment failures, but the trials were small and lacked sufficient statistical power.
Four additional studies included in the review compared crotamiton with lindane (100 patients), lindane with sulfur (68 patients), benzyl benzoate with sulfur (158 patients), and benzyl benzoate with natural synergized pyrethrins (240 patients). None demonstrated superiority, but all were small studies.1 A single small trial of 55 patients that compared oral ivermectin 200 mcg/kg with placebo showed failure rates at one week of 21% and 85%, respectively (NNT=2; RR=0.24; 95% CI, 0.12-0.51).1
Topical permethrin vs oral ivermectin
A 2014 systematic review of 5 studies included 2 new studies done after the 2007 Cochrane review.2 The new RCTs compared a single application of 5% topical permethrin with a single dose or 2 doses of oral ivermectin given 2 weeks apart. No statistically significant differences were found in these studies.2 Both underpowered studies favored topical permethrin, however.
The P value was .42 in one study of 242 adults and children, and this trial showed a clinical cure rate at 2 weeks of 93% using topical permethrin vs 86% using oral ivermectin.2
The other study of 120 adults and children didn’t report a P value or identify statistically significant differences between topical permethrin and oral ivermectin.2 This study reported a clinical cure rate of 87% with topical permethrin, 78% with a single dose of oral ivermectin, and 67% with 2 doses of oral ivermectin 2 weeks apart.2
Ivermectin may control endemic scabies better than permethrin
A 2015 randomized controlled trial with 2051 patients compared mass treatments in a scabies-endemic population in Fiji.3 The trial had 3 arms: a standard-care group treated with 5% topical permethrin if symptoms were present and retreated at 2 weeks if symptoms persisted; a permethrin group in which all participants, whether infected or not, received 5% permethrin followed by a second dose at 7 to 14 days if symptoms persisted; and an oral ivermectin group in which participants were treated with 200 mcg/kg, repeated in 7 to 14 days for those with baseline scabies.
At 12 months, the relative risk reductions were 94% (95% CI, 83%-100%) for the ivermectin group, 62% (95% CI, 49%-75%) for the permethrin group, and 49% (95% CI, 37%-60%) for the standard-care group.3 The study had multiple limitations, and all groups were permitted to receive standard care at any time during the 12-month follow-up period. Nevertheless, the findings suggest that endemic scabies control with ivermectin may be superior to topical permethrin.
RECOMMENDATIONS
The Centers for Disease Control and Prevention (CDC)4 and the European Guideline for the Management of Scabies5 both recommend topical permethrin as first-line therapy for classical scabies and note that oral ivermectin may be safe and effective but isn’t licensed for scabies treatment in most countries. Ivermectin isn’t approved by the United States Food and Drug Administration for treating scabies.
The CDC recommendations note that the safety of ivermectin in children weighing less than 15 kg and pregnant women hasn’t been established.4
1. Strong M, Johnstone P. Interventions for treating scabies. Cochrane Database Syst Rev. 2007;(3):CD000320.
2. Johnstone P, Strong M. Scabies. BMJ Clinical Evidence. 2014:1707.
3. Romani L, Whitfeld MJ, Koroivueta J, et al. Mass drug administration for scabies control in a population with endemic disease. N Engl J Med. 2015;373:2305-2313.
4. Centers for Disease Control and Prevention. Scabies. Treatment. Available at: www.cdc.gov/parasites/scabies/health_professionals/meds.html. Accessed February 26, 2016.
5. Scott G, Chosidow O. European guideline for the management of scabies, 2010. Int J STD AIDS. 2011;22:301-303.
EVIDENCE SUMMARY
A 2007 Cochrane review on scabies treatment identified 11 trials that evaluated permethrin for treating scabies.1 In 2 trials, 140 patients were randomized to receive either 200 mcg/kg of oral ivermectin or overnight application of 5% topical permethrin. Topical permethrin was superior to oral ivermectin with failure rates at 2 weeks of 8% and 39%, respectively (number needed to treat [NNT]=4; risk ratio [RR]=4.61; 95% confidence interval [CI], 2.07-10.26).
Two trials compared 5% topical permethrin with 10% topical crotamiton in 194 patients with follow-up at 28 days. Permethrin was superior to crotamiton with failure rates of 6% and 26%, respectively (NNT=6; RR=0.24; 95% CI, 0.10-0.55).
Five trials with 753 patients compared topical permethrin, 2.5% to 3.5%, with topical 1% lindane, but heterogeneity precluded pooling all the studies. In the 3 studies (554 patients) that were comparable, topical 3.5% permethrin was superior to lindane after a single application of each with failure rates of 9% and 15%, respectively (NNT=17; RR=0.59; 95% CI, 0.37-0.95).
Two trials that compared permethrin with topical benzyl benzoate (53 patients) and natural synergized pyrethrins (40 patients) showed no difference in treatment failures, but the trials were small and lacked sufficient statistical power.
Four additional studies included in the review compared crotamiton with lindane (100 patients), lindane with sulfur (68 patients), benzyl benzoate with sulfur (158 patients), and benzyl benzoate with natural synergized pyrethrins (240 patients). None demonstrated superiority, but all were small studies.1 A single small trial of 55 patients that compared oral ivermectin 200 mcg/kg with placebo showed failure rates at one week of 21% and 85%, respectively (NNT=2; RR=0.24; 95% CI, 0.12-0.51).1
Topical permethrin vs oral ivermectin
A 2014 systematic review of 5 studies included 2 new studies done after the 2007 Cochrane review.2 The new RCTs compared a single application of 5% topical permethrin with a single dose or 2 doses of oral ivermectin given 2 weeks apart. No statistically significant differences were found in these studies.2 Both underpowered studies favored topical permethrin, however.
The P value was .42 in one study of 242 adults and children, and this trial showed a clinical cure rate at 2 weeks of 93% using topical permethrin vs 86% using oral ivermectin.2
The other study of 120 adults and children didn’t report a P value or identify statistically significant differences between topical permethrin and oral ivermectin.2 This study reported a clinical cure rate of 87% with topical permethrin, 78% with a single dose of oral ivermectin, and 67% with 2 doses of oral ivermectin 2 weeks apart.2
Ivermectin may control endemic scabies better than permethrin
A 2015 randomized controlled trial with 2051 patients compared mass treatments in a scabies-endemic population in Fiji.3 The trial had 3 arms: a standard-care group treated with 5% topical permethrin if symptoms were present and retreated at 2 weeks if symptoms persisted; a permethrin group in which all participants, whether infected or not, received 5% permethrin followed by a second dose at 7 to 14 days if symptoms persisted; and an oral ivermectin group in which participants were treated with 200 mcg/kg, repeated in 7 to 14 days for those with baseline scabies.
At 12 months, the relative risk reductions were 94% (95% CI, 83%-100%) for the ivermectin group, 62% (95% CI, 49%-75%) for the permethrin group, and 49% (95% CI, 37%-60%) for the standard-care group.3 The study had multiple limitations, and all groups were permitted to receive standard care at any time during the 12-month follow-up period. Nevertheless, the findings suggest that endemic scabies control with ivermectin may be superior to topical permethrin.
RECOMMENDATIONS
The Centers for Disease Control and Prevention (CDC)4 and the European Guideline for the Management of Scabies5 both recommend topical permethrin as first-line therapy for classical scabies and note that oral ivermectin may be safe and effective but isn’t licensed for scabies treatment in most countries. Ivermectin isn’t approved by the United States Food and Drug Administration for treating scabies.
The CDC recommendations note that the safety of ivermectin in children weighing less than 15 kg and pregnant women hasn’t been established.4
1. Strong M, Johnstone P. Interventions for treating scabies. Cochrane Database Syst Rev. 2007;(3):CD000320.
2. Johnstone P, Strong M. Scabies. BMJ Clinical Evidence. 2014:1707.
3. Romani L, Whitfeld MJ, Koroivueta J, et al. Mass drug administration for scabies control in a population with endemic disease. N Engl J Med. 2015;373:2305-2313.
4. Centers for Disease Control and Prevention. Scabies. Treatment. Available at: www.cdc.gov/parasites/scabies/health_professionals/meds.html. Accessed February 26, 2016.
5. Scott G, Chosidow O. European guideline for the management of scabies, 2010. Int J STD AIDS. 2011;22:301-303.
Evidence-based answers from the Family Physicians Inquiries Network
EVIDENCE-BASED ANSWER:
Topical permethrin is the most effective treatment for classic scabies (strength of recommendation [SOR]: A, meta-analyses with consistent results).
Topical lindane and crotamiton are inferior to permethrin but appear equivalent to each other and benzyl benzoate, sulfur, and natural synergized pyrethrins (SOR: B, limited randomized trials).
Although not as effective as topical permethrin, oral ivermectin is an effective treatment compared with placebo (SOR: B, a single small randomized trial).
Oral ivermectin may reduce the prevalence of scabies at one year in populations with endemic disease more than topical permethrin (SOR: B, a single randomized trial).
Do ACE inhibitors or ARBs help prevent kidney disease in patients with diabetes and normal BP?
EVIDENCE SUMMARY
A 2011 meta-analysis of 5 RCTs (total 2975 patients) that compared ACE inhibitor therapy with placebo in diabetic patients without hypertension and albuminuria found that ACE inhibitors reduced the risk of new-onset microalbuminuria or macroalbuminuria by 18% (relative risk [RR]=0.82; 95% confidence interval [CI], 0.73-0.92).1 Normal albuminuria was defined in all included studies as an albumin excretion rate of <30 mg/d on a timed specimen confirmed with 3 serial measurements.
The RCTs included patients treated with lisinopril, enalapril, and perindopril. All but one examined patients with type 1 diabetes (2781 patients). The study that evaluated type 2 diabetes (194 patients) assessed patients with hypertension who used other antihypertensives to achieve normal blood pressure targets before ACE inhibitor initiation, a potential limitation.
Compared with placebo or no treatment, ACE inhibitor therapy reduced the risk of death from any cause (6 studies; 11,350 patients; RR=0.84; 95% CI, 0.73-0.97).1 Patient populations across pooled RCTs were heterogeneous, including subjects with type 1 and type 2 diabetes, with or without hypertension, and with or without albuminuria.
ACE inhibitors increase risk of cough
Patients taking an ACE inhibitor have an increased risk of cough (6 studies; 11,791 patients; RR=1.84; 95% CI, 1.24-2.72).1 ACE inhibitor therapy doesn’t increase the risk of headache or hyperkalemia.
ARBs don’t help prevent diabetic kidney disease in normotensive patients
The 2011 meta-analysis also included 5 RCTs (4604 patients, approximately 3000 with type 2 diabetes and more than 1000 with type 1 diabetes) that compared ARBs with placebo in patients without hypertension.1 Unlike ACE inhibitor therapy, ARB treatment didn’t significantly affect new-onset microalbuminuria or macroalbuminuria (RR=1.06; 95% CI, 0.67-1.69).
The trials evaluated losartan, candesartan, olmesartan, and valsartan. One study used other antihypertensives to achieve target blood pressure, and another included patients of any albuminuria status.
Compared with placebo or no treatment, ARBs didn’t reduce the risk of death (5 studies; 7653 patients; RR=1.12; 95% CI, 0.88-1.41).1 All 5 RCTs assessed normoalbuminuric patients. Three of the 5 studies examined normotensive patients; one evaluated only hypertensive patients, and another assessed mostly hypertensive patients.
ARBs usually don’t produce significant adverse effects
Within the meta-analysis, ARBs didn’t increase risk of cough, headache, or hyperkalemia.1
1. Lv J, Perkovic V, Foote CV, et al. Antihypertensive agents for preventing diabetic kidney disease. Cochrane Database Syst Rev. 2012;(12):CD004136.
EVIDENCE SUMMARY
A 2011 meta-analysis of 5 RCTs (total 2975 patients) that compared ACE inhibitor therapy with placebo in diabetic patients without hypertension and albuminuria found that ACE inhibitors reduced the risk of new-onset microalbuminuria or macroalbuminuria by 18% (relative risk [RR]=0.82; 95% confidence interval [CI], 0.73-0.92).1 Normal albuminuria was defined in all included studies as an albumin excretion rate of <30 mg/d on a timed specimen confirmed with 3 serial measurements.
The RCTs included patients treated with lisinopril, enalapril, and perindopril. All but one examined patients with type 1 diabetes (2781 patients). The study that evaluated type 2 diabetes (194 patients) assessed patients with hypertension who used other antihypertensives to achieve normal blood pressure targets before ACE inhibitor initiation, a potential limitation.
Compared with placebo or no treatment, ACE inhibitor therapy reduced the risk of death from any cause (6 studies; 11,350 patients; RR=0.84; 95% CI, 0.73-0.97).1 Patient populations across pooled RCTs were heterogeneous, including subjects with type 1 and type 2 diabetes, with or without hypertension, and with or without albuminuria.
ACE inhibitors increase risk of cough
Patients taking an ACE inhibitor have an increased risk of cough (6 studies; 11,791 patients; RR=1.84; 95% CI, 1.24-2.72).1 ACE inhibitor therapy doesn’t increase the risk of headache or hyperkalemia.
ARBs don’t help prevent diabetic kidney disease in normotensive patients
The 2011 meta-analysis also included 5 RCTs (4604 patients, approximately 3000 with type 2 diabetes and more than 1000 with type 1 diabetes) that compared ARBs with placebo in patients without hypertension.1 Unlike ACE inhibitor therapy, ARB treatment didn’t significantly affect new-onset microalbuminuria or macroalbuminuria (RR=1.06; 95% CI, 0.67-1.69).
The trials evaluated losartan, candesartan, olmesartan, and valsartan. One study used other antihypertensives to achieve target blood pressure, and another included patients of any albuminuria status.
Compared with placebo or no treatment, ARBs didn’t reduce the risk of death (5 studies; 7653 patients; RR=1.12; 95% CI, 0.88-1.41).1 All 5 RCTs assessed normoalbuminuric patients. Three of the 5 studies examined normotensive patients; one evaluated only hypertensive patients, and another assessed mostly hypertensive patients.
ARBs usually don’t produce significant adverse effects
Within the meta-analysis, ARBs didn’t increase risk of cough, headache, or hyperkalemia.1
1. Lv J, Perkovic V, Foote CV, et al. Antihypertensive agents for preventing diabetic kidney disease. Cochrane Database Syst Rev. 2012;(12):CD004136.
1. Lv J, Perkovic V, Foote CV, et al. Antihypertensive agents for preventing diabetic kidney disease. Cochrane Database Syst Rev. 2012;(12):CD004136.
Evidence-based answers from the Family Physicians Inquiries Network
EVIDENCE-BASED ANSWER:
Yes for angiotensin-converting enzyme (ACE) inhibitors, no for angiotensin receptor blockers (ARBs).
In normotensive patients with type 1 and type 2 diabetes, ACE inhibitor therapy reduces the risk of developing diabetic kidney disease, defined as new-onset microalbuminuria or macroalbuminuria, by 18% (strength of recommendation [SOR]: C, meta-analysis of randomized controlled trials [RCTs], disease-oriented evidence).
ACE inhibitor treatment improves all-cause mortality by 16% in patients with diabetes, including patients with and without hypertension. Patients on ACE inhibitor therapy are at increased risk of cough (SOR: A, meta-analysis of RCTs).
ARB therapy doesn’t lower the risk of developing kidney disease in normotensive patients with type 2 diabetes (SOR: C, meta-analysis of RCTs, disease-oriented evidence); nor does it reduce all-cause mortality in patients with or without hypertension (SOR: A, meta-analysis of RCTs). ARBs aren’t associated with significant adverse events (SOR: A, meta-analysis of RCTs).

Can mobile technology improve weight loss in overweight and obese patients?
EVIDENCE SUMMARY
A systematic review and meta-analysis of 84 moderate- to high-quality RCTs with 24,010 patients evaluated the use of “eHealth” interventions in preventing and treating overweight and obesity in adults 35 to 65 years of age (75% female).1 The studies included 183 active intervention arms with durations as long as 24 months (64% <6 months, 46% >6 months). The term eHealth included all forms of information technology used to deliver health care, but predominantly the Internet (Web site/Web-based), e-mail, and text messaging. Sixty percent (84) of eHealth interventional arms used one modality and 34% (47) used 2. Some intervention arms included non-eHealth modalities, such as paper-based measures and counseling.
The eHealth interventions were associated with significantly greater weight loss than minimal or no intervention (TABLE).1 Comparing eHealth interventions with no intervention showed significant differences by eHealth type (P=.05). The greatest weight loss accompanied interventions that combined Web-based measures with a non-eHealth intervention, (mean difference [MD]= −3.7 kg; 95% confidence interval [CI], −4.46 to −2.94), followed by mobile interventions alone (MD= −2.4 kg; 95% CI, −4.09 to −0.71) and Web-based interventions alone (MD= −2.2 kg; 95% CI, −2.98 to −1.44).

Similarly, comparing combined interventions (eHealth + eHealth or eHealth + non-eHealth) with a minimal intervention control showed a trend for difference by eHealth type (P=.005). Only a combination of eHealth with non-eHealth interventions resulted in significantly greater weight loss (Web site + non-eHealth: MD= −2.7 kg; 95% CI, −3.76 to −1.54; text + non-eHealth: MD= −1.8 kg; 95% CI, −2.49 to −1.12; computer + non-eHealth: MD=1.1 kg; 95% CI, −1.36 to −0.89).
Personal coaching plus smartphone monitoring beats interactive app
A 3-arm RCT of 385 overweight and obese participants (mean body mass index [BMI], 35 kg/m2) 18 to 35 years of age compared the effectiveness of weight loss interventions delivered by interactive smartphone application (CP [cell phone]), personal coaching enhanced by smartphone self-monitoring (PC), and usual care (control).2 The PC arm attended 6 weekly group sessions and received monthly phone calls. The usual care arm received 3 handouts on healthy eating and physical activity.
The CP arm showed the least amount of weight loss (−0.9 kg, −1.5 kg, and −1.0 kg at 6, 12, and 24 months, respectively) and no significant difference compared with controls at all measurement points. The PC arm had significantly greater weight loss than controls at 6 months (−1.9 kg; 95% CI, −3.17 to −0.67) and significantly greater weight loss than CP at 6 months (−2.2 kg; 95% CI, −3.42 to −0.97) and 12 months (−2.1 kg; 95% CI, −3.94 to −0.27). After 24 months, however, there was no significant difference in mean weight loss among treatment arms.
Automated behavioral program reduced weight and waist circumference
An RCT of 339 prediabetic, overweight, and obese patients 30 to 69 years old (mean BMI, 31 kg/m2) compared the effectiveness of Alive-PD, a fully automated, tailored, behavioral program, to usual care (control) for diabetes prevention.3 In addition to behavioral support, the program included weekly emails, Web-based tracking, a mobile phone app, and automated phone calls.
At 6 months, the intervention group had significantly greater mean weight loss (−3.4 kg vs −1.3 kg; P<.001), mean BMI (−1.1 kg/m2 vs −0.4 kg/m2; P<
Web-based program improves weight loss at 3 months, but not 12 months
An RCT of 65 overweight and obese participants (mean BMI, 32 kg/m2) with at least one cardiovascular risk factor compared the effect of a Web-based program with usual care on weight change at 3, 6, and 12 months.4 Participants in the intervention group were provided with Bluetooth-enabled scales and accelerometer activity bands to allow daily uploads. The Web-based program also provided weekly feedback based on the participant’s performance and a food diary.
The Web-based group had significantly greater weight loss at 3 months (mean= −3.4 kg [95% CI, −4.70 to −2.13] vs −0.5 kg [95% CI, −1.55 to 0.52]; P<.001) and 6 months (mean= −3.4 kg [95% CI, −4.95 to −1.98] vs −0.8 kg [95% CI, −2.23 to 0.61]; P=.02). At 12 months, however, the groups showed no significant difference (mean= −2.4 kg [95% CI, −3.48 to −0.97] vs −1.8 kg [95% CI, −3.15 to −0.44]; P=.77).
RECOMMENDATIONS
Guidelines from the American College of Cardiology, American Heart Association, and Obesity Society state that electronically delivered weight-loss programs may be prescribed, but may result in smaller weight loss than face-to-face interventions (SOR: B, moderate evidence from RCTs with some limitations or non-randomized trials).5
1. Hutchesson MJ, Rollo ME, Krukowski R, et al. eHealth interventions for the prevention and treatment of overweight and obesity in adults: a systematic review with meta-analysis. Obes Rev. 2015;16:376-392.
2. Svetkey LP, Batch BC, Lin P, et al. Cell phone intervention for you (CITY): A randomized, controlled trial of behavioral weight loss intervention for young adults using mobile technology. Obesity (Silver Spring). 2015;23:2133-2141.
3. Block G, Azar K, Romanelli R, et al. Diabetes prevention and weight loss with a fully automated behavioral intervention by email, web, and mobile phone: a randomized controlled trial among persons with prediabetes. J Med Internet Res. 2015;17:e240.
4. Watson S, Woodside J, Ware L, et al. Effect of a web-based behavior change program on weight loss and cardiovascular risk factors in overweight and obese adults at high risk of developing cardiovascular disease: randomized controlled trial. J Med Internet Res. 2015;17:e177.
5. Jensen MD, Ryan DH, Apovian CM, et al. 2013 AHA/ACC/TOS guideline for the management of overweight and obesity in adults: a report of the American College of Cardiology/American Heart Association Task Force on Practice Guidelines and The Obesity Society. Circulation. 2014;129:S102-S138.
EVIDENCE SUMMARY
A systematic review and meta-analysis of 84 moderate- to high-quality RCTs with 24,010 patients evaluated the use of “eHealth” interventions in preventing and treating overweight and obesity in adults 35 to 65 years of age (75% female).1 The studies included 183 active intervention arms with durations as long as 24 months (64% <6 months, 46% >6 months). The term eHealth included all forms of information technology used to deliver health care, but predominantly the Internet (Web site/Web-based), e-mail, and text messaging. Sixty percent (84) of eHealth interventional arms used one modality and 34% (47) used 2. Some intervention arms included non-eHealth modalities, such as paper-based measures and counseling.
The eHealth interventions were associated with significantly greater weight loss than minimal or no intervention (TABLE).1 Comparing eHealth interventions with no intervention showed significant differences by eHealth type (P=.05). The greatest weight loss accompanied interventions that combined Web-based measures with a non-eHealth intervention, (mean difference [MD]= −3.7 kg; 95% confidence interval [CI], −4.46 to −2.94), followed by mobile interventions alone (MD= −2.4 kg; 95% CI, −4.09 to −0.71) and Web-based interventions alone (MD= −2.2 kg; 95% CI, −2.98 to −1.44).
Similarly, comparing combined interventions (eHealth + eHealth or eHealth + non-eHealth) with a minimal intervention control showed a trend for difference by eHealth type (P=.005). Only a combination of eHealth with non-eHealth interventions resulted in significantly greater weight loss (Web site + non-eHealth: MD= −2.7 kg; 95% CI, −3.76 to −1.54; text + non-eHealth: MD= −1.8 kg; 95% CI, −2.49 to −1.12; computer + non-eHealth: MD=1.1 kg; 95% CI, −1.36 to −0.89).
Personal coaching plus smartphone monitoring beats interactive app
A 3-arm RCT of 385 overweight and obese participants (mean body mass index [BMI], 35 kg/m2) 18 to 35 years of age compared the effectiveness of weight loss interventions delivered by interactive smartphone application (CP [cell phone]), personal coaching enhanced by smartphone self-monitoring (PC), and usual care (control).2 The PC arm attended 6 weekly group sessions and received monthly phone calls. The usual care arm received 3 handouts on healthy eating and physical activity.
The CP arm showed the least amount of weight loss (−0.9 kg, −1.5 kg, and −1.0 kg at 6, 12, and 24 months, respectively) and no significant difference compared with controls at all measurement points. The PC arm had significantly greater weight loss than controls at 6 months (−1.9 kg; 95% CI, −3.17 to −0.67) and significantly greater weight loss than CP at 6 months (−2.2 kg; 95% CI, −3.42 to −0.97) and 12 months (−2.1 kg; 95% CI, −3.94 to −0.27). After 24 months, however, there was no significant difference in mean weight loss among treatment arms.
Automated behavioral program reduced weight and waist circumference
An RCT of 339 prediabetic, overweight, and obese patients 30 to 69 years old (mean BMI, 31 kg/m2) compared the effectiveness of Alive-PD, a fully automated, tailored, behavioral program, to usual care (control) for diabetes prevention.3 In addition to behavioral support, the program included weekly emails, Web-based tracking, a mobile phone app, and automated phone calls.
At 6 months, the intervention group had significantly greater mean weight loss (−3.4 kg vs −1.3 kg; P<.001), mean BMI (−1.1 kg/m2 vs −0.4 kg/m2; P<
Web-based program improves weight loss at 3 months, but not 12 months
An RCT of 65 overweight and obese participants (mean BMI, 32 kg/m2) with at least one cardiovascular risk factor compared the effect of a Web-based program with usual care on weight change at 3, 6, and 12 months.4 Participants in the intervention group were provided with Bluetooth-enabled scales and accelerometer activity bands to allow daily uploads. The Web-based program also provided weekly feedback based on the participant’s performance and a food diary.
The Web-based group had significantly greater weight loss at 3 months (mean= −3.4 kg [95% CI, −4.70 to −2.13] vs −0.5 kg [95% CI, −1.55 to 0.52]; P<.001) and 6 months (mean= −3.4 kg [95% CI, −4.95 to −1.98] vs −0.8 kg [95% CI, −2.23 to 0.61]; P=.02). At 12 months, however, the groups showed no significant difference (mean= −2.4 kg [95% CI, −3.48 to −0.97] vs −1.8 kg [95% CI, −3.15 to −0.44]; P=.77).
RECOMMENDATIONS
Guidelines from the American College of Cardiology, American Heart Association, and Obesity Society state that electronically delivered weight-loss programs may be prescribed, but may result in smaller weight loss than face-to-face interventions (SOR: B, moderate evidence from RCTs with some limitations or non-randomized trials).5
1. Hutchesson MJ, Rollo ME, Krukowski R, et al. eHealth interventions for the prevention and treatment of overweight and obesity in adults: a systematic review with meta-analysis. Obes Rev. 2015;16:376-392.
2. Svetkey LP, Batch BC, Lin P, et al. Cell phone intervention for you (CITY): A randomized, controlled trial of behavioral weight loss intervention for young adults using mobile technology. Obesity (Silver Spring). 2015;23:2133-2141.
3. Block G, Azar K, Romanelli R, et al. Diabetes prevention and weight loss with a fully automated behavioral intervention by email, web, and mobile phone: a randomized controlled trial among persons with prediabetes. J Med Internet Res. 2015;17:e240.
4. Watson S, Woodside J, Ware L, et al. Effect of a web-based behavior change program on weight loss and cardiovascular risk factors in overweight and obese adults at high risk of developing cardiovascular disease: randomized controlled trial. J Med Internet Res. 2015;17:e177.
5. Jensen MD, Ryan DH, Apovian CM, et al. 2013 AHA/ACC/TOS guideline for the management of overweight and obesity in adults: a report of the American College of Cardiology/American Heart Association Task Force on Practice Guidelines and The Obesity Society. Circulation. 2014;129:S102-S138.
Evidence-based answers from the Family Physicians Inquiries Network
EVIDENCE-BASED ANSWER:
Yes, this technology can help in the short term. Mobile technology compared with minimal or no intervention increases short-term (<6 months) weight loss (1.4 to 2.7 kg) in overweight and obese patients (strength of recommendation [SOR]: A, meta-analysis of good-quality studies and randomized controlled trials [RCTs]).
Interventions that combine nonelectronic measures with mobile technology increase weight loss more effectively (3.7 kg) than no intervention (SOR: A, meta-analysis of good-quality studies and RCTs).
Using mobile technology shows no significant benefits for weight loss after 12 months (SOR: A, multiple good-quality RCTs).

Does vitamin D without calcium reduce fracture risk?
EVIDENCE SUMMARY
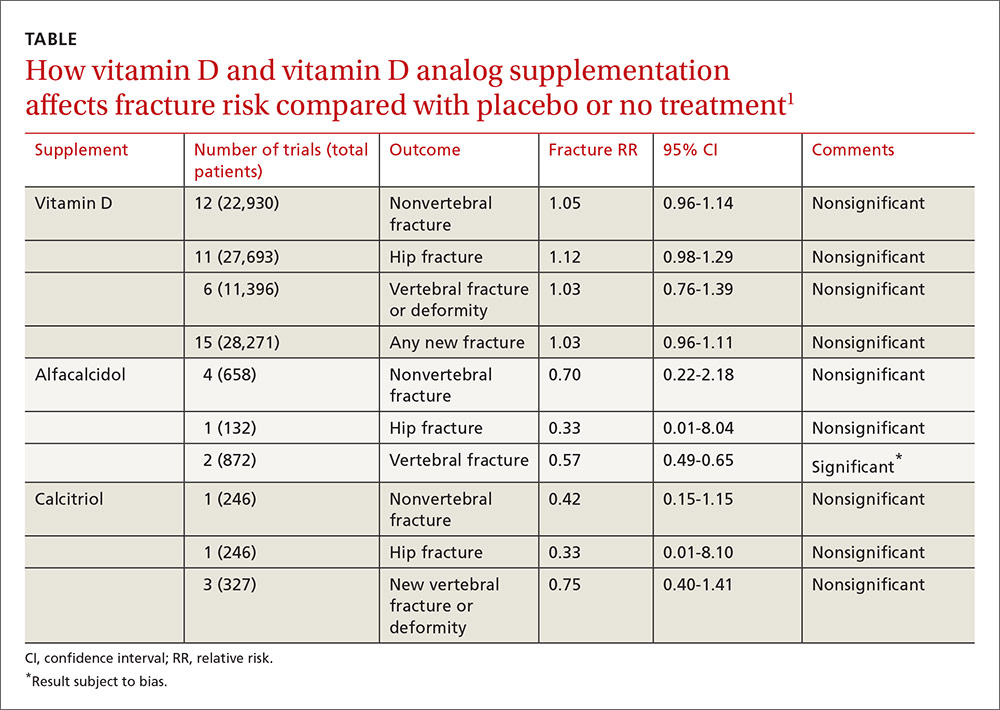
A 2014 meta-analysis of 15 trials (quasi-random and RCT) with a total of 28,271 patients that compared the effect of vitamin D on fracture risk with placebo or no treatment, found no benefit for vitamin D supplementation (TABLE).1 Patients lived in community and nursing home settings and ranged in age from 50 to 85 years; 24% to 100% were female.
Only 3 trials required patients to have had a previous fracture. Exclusions included: diseases affecting bone metabolism, cognitive impairment, drugs affecting bone metabolism (bisphosphonates, selective estrogen receptor modulators, and corticosteroids), renal failure, hypercalcemia, nephrolithiasis, and decreased mobility (recent stroke recovery and Parkinson’s disease).
Formulations of vitamin D included cholecalciferol (D3) 400 to 2000 IU/d for 4 months to 5 years or 100,000 to 500,000 IU every 3 to 12 months for 1 to 5 years; calcifediol (25(OH)D3) 600 IU/d for 4 years; and ergocalciferol (D2) 400 IU/d for 2 years or 3000 to 300,000 IU every 3 to 12 months for 10 months to 3 years.
Vitamin D analogs generally have no benefit either
The same meta-analysis compared vitamin D analogs to placebo or no treatment (8 trials, quasi-random and RCT, 1743 patients) on the risk of fracture, again finding no benefit in all but one case. Included patients were mostly by referral to tertiary or university hospitals and outpatient community settings.
Most of the studies included only a small number of patients (about 200), with the largest study having 740 patients. The age range was 50 to 77 years, and 50% to 100% were female. Most of the trials required patients to have osteoporosis or vitamin D deficiency with a previous vertebral deformity on imaging. Study exclusions included osteomalacia, malabsorption, hyperparathyroidism, active kidney stones, history of hypercalciuria, cancer, incurable disease, dementia, severe chronic illness (renal or liver failure), recent stroke or fracture, and drugs that affect bone metabolism.
Vitamin D analogs were given as alfacalcidol (1-alphahydroxyvitamin D3) 0.5 mcg twice daily or 1 mcg/d for 36 weeks to 2 years or calcitriol (1,25-dihydroxyvitamin D3) 0.25 to 1 mcg once or twice daily for one to 3 years. Researchers found a significant reduction in vertebral (but not nonvertebral or hip) fractures with alfacalcidol, but the finding occurred in a single trial that was assessed by the authors of the meta-analysis as subject to bias.
Supplementation doesn’t affect mortality, but does have some side effects
Patients taking vitamin D or an analog with or without calcium showed no difference in risk of death compared with patients taking placebo (29 trials, 71,032 patients; relative risk [RR]=0.97; 95% confidence interval [CI], 0.93-1.01).
Patients taking vitamin D or an analog were more likely than controls to have mild hypercalcemia, with an average increase of 2.7 mmol/L (21 trials, 17,124 patients; RR=2.28; 95% CI, 1.57-3.31). Patients taking calcitriol had the highest risk (4 trials, 988 patients; RR=4.41; 95% CI, 2.14-9.09).
Gastrointestinal adverse effects (4% increase) and renal calculi or mild renal insufficiency (16% increase) were more common with vitamin D and analogs than placebo (GI adverse effects: 15 trials, 47,761 patients; RR=1.04; 95% CI, 1.00-1.08; renal calculi or mild renal insufficiency: 11 trials, 46,548 patients; RR=1.16; 95% CI, 1.02-1.33).
RECOMMENDATIONS
There are no guidelines recommending vitamin D supplementation without calcium to prevent fracture.
1. Avenell A, Mak JC, O’Connell D. Vitamin D and vitamin D analogues for preventing fractures in post-menopausal women and older men. Cochrane Database Syst Rev. 2014;4:CD000227.
EVIDENCE SUMMARY
A 2014 meta-analysis of 15 trials (quasi-random and RCT) with a total of 28,271 patients that compared the effect of vitamin D on fracture risk with placebo or no treatment, found no benefit for vitamin D supplementation (TABLE).1 Patients lived in community and nursing home settings and ranged in age from 50 to 85 years; 24% to 100% were female.
Only 3 trials required patients to have had a previous fracture. Exclusions included: diseases affecting bone metabolism, cognitive impairment, drugs affecting bone metabolism (bisphosphonates, selective estrogen receptor modulators, and corticosteroids), renal failure, hypercalcemia, nephrolithiasis, and decreased mobility (recent stroke recovery and Parkinson’s disease).
Formulations of vitamin D included cholecalciferol (D3) 400 to 2000 IU/d for 4 months to 5 years or 100,000 to 500,000 IU every 3 to 12 months for 1 to 5 years; calcifediol (25(OH)D3) 600 IU/d for 4 years; and ergocalciferol (D2) 400 IU/d for 2 years or 3000 to 300,000 IU every 3 to 12 months for 10 months to 3 years.
Vitamin D analogs generally have no benefit either
The same meta-analysis compared vitamin D analogs to placebo or no treatment (8 trials, quasi-random and RCT, 1743 patients) on the risk of fracture, again finding no benefit in all but one case. Included patients were mostly by referral to tertiary or university hospitals and outpatient community settings.
Most of the studies included only a small number of patients (about 200), with the largest study having 740 patients. The age range was 50 to 77 years, and 50% to 100% were female. Most of the trials required patients to have osteoporosis or vitamin D deficiency with a previous vertebral deformity on imaging. Study exclusions included osteomalacia, malabsorption, hyperparathyroidism, active kidney stones, history of hypercalciuria, cancer, incurable disease, dementia, severe chronic illness (renal or liver failure), recent stroke or fracture, and drugs that affect bone metabolism.
Vitamin D analogs were given as alfacalcidol (1-alphahydroxyvitamin D3) 0.5 mcg twice daily or 1 mcg/d for 36 weeks to 2 years or calcitriol (1,25-dihydroxyvitamin D3) 0.25 to 1 mcg once or twice daily for one to 3 years. Researchers found a significant reduction in vertebral (but not nonvertebral or hip) fractures with alfacalcidol, but the finding occurred in a single trial that was assessed by the authors of the meta-analysis as subject to bias.
Supplementation doesn’t affect mortality, but does have some side effects
Patients taking vitamin D or an analog with or without calcium showed no difference in risk of death compared with patients taking placebo (29 trials, 71,032 patients; relative risk [RR]=0.97; 95% confidence interval [CI], 0.93-1.01).
Patients taking vitamin D or an analog were more likely than controls to have mild hypercalcemia, with an average increase of 2.7 mmol/L (21 trials, 17,124 patients; RR=2.28; 95% CI, 1.57-3.31). Patients taking calcitriol had the highest risk (4 trials, 988 patients; RR=4.41; 95% CI, 2.14-9.09).
Gastrointestinal adverse effects (4% increase) and renal calculi or mild renal insufficiency (16% increase) were more common with vitamin D and analogs than placebo (GI adverse effects: 15 trials, 47,761 patients; RR=1.04; 95% CI, 1.00-1.08; renal calculi or mild renal insufficiency: 11 trials, 46,548 patients; RR=1.16; 95% CI, 1.02-1.33).
RECOMMENDATIONS
There are no guidelines recommending vitamin D supplementation without calcium to prevent fracture.
1. Avenell A, Mak JC, O’Connell D. Vitamin D and vitamin D analogues for preventing fractures in post-menopausal women and older men. Cochrane Database Syst Rev. 2014;4:CD000227.
1. Avenell A, Mak JC, O’Connell D. Vitamin D and vitamin D analogues for preventing fractures in post-menopausal women and older men. Cochrane Database Syst Rev. 2014;4:CD000227.
Evidence-based answers from the Family Physicians Inquiries Network
EVIDENCE-BASED ANSWER:
No. Supplemental vitamin D without calcium—in doses averaging as much as 800 IU per day—doesn’t reduce the risk of hip, vertebral, or nonvertebral fractures in postmenopausal women and older men (strength of recommendation [SOR]: A, large, high-quality meta-analysis of randomized or quasi-randomized placebo-controlled trials).
The vitamin D analogs alfacalcidol and calcitriol also don’t reduce hip or nonvertebral fractures (SOR: A, multiple randomized, controlled trials [RCTs]), although alfacalcidol (but not calcitriol) does reduce vertebral fractures by 43% (SOR: B, one RCT and one quasi-randomized trial with potential for bias)
Vitamin D supplementation, with or without calcium, doesn’t affect mortality. It does double the risk of mild hypercalcemia (about 2.7 mmol/L increase), raise the risk of renal calculi or mild renal insufficiency by 16%, and slightly increase (4%) gastrointestinal adverse effects (SOR: A, meta-analysis of RCTs or quasi-randomized trials).

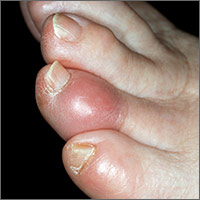
How do clinical prediction rules compare with joint fluid analysis in diagnosing gout?
EVIDENCE-BASED ANSWER:
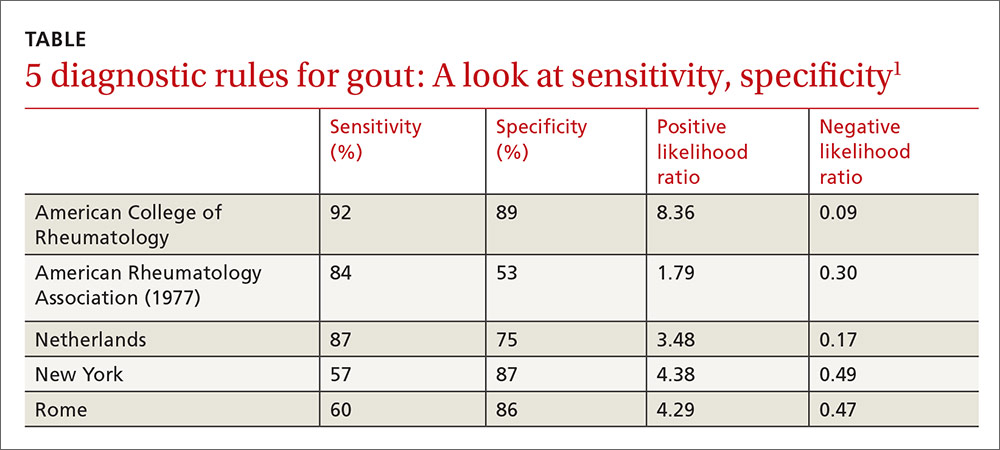
Clinical prediction rules effectively diagnose gout without joint fluid analysis. The American College of Rheumatology clinical prediction rules, the most accurate rules developed for research purposes, have a sensitivity of 92%, specificity of 89%, positive likelihood ratio of 8.36, and negative likelihood ratio of 0.09 (strength of recommendation [SOR]: A, prospective cohort studies).
The Netherlands criteria, developed for use in primary care, have a positive predictive value of more than 80%, a positive likelihood ratio of 3.48, and a negative likelihood ratio of 0.17 (SOR: A, prospective cohort study).
EVIDENCE SUMMARY
In 2015, the American College of Rheumatology (ACR) redefined the clinical criteria for diagnosis of gout based on a 3-step system1 that can be found at: http://goutclassificationcalculator.auckland.ac.nz. The ACR rule was derived from a cross-sectional study of 983 patients in 25 rheumatology centers in 16 countries who presented with a swollen joint.2 Of the 983 patients, 509 had gout; the prevalence was 52%. Data from 653 of these patients were used to develop the rule and then validated in the remaining 330 patients.
Compared with the gold standard of monosodium urate crystals in synovial fluid, the ACR rule has a sensitivity of 92% and a specificity of 89%. The rule, designed for the research setting, involves using synovial fluid analysis, ultrasound imaging, and radiography, which makes it less useful in a primary care setting.
The Netherlands rule for primary care
A prospective diagnostic study in 328 family medicine patients (74% male; mean age 57) with monoarthritis tested the ability of multiple clinical variables to diagnose gout using monosodium urate crystals in synovial fluid as the gold standard.3 The prevalence of gout in this population was 57%.
The best diagnostic rule (Netherlands rule) comprised the following predefined variables: male sex, previous patient-reported arthritis attack, onset within one day, joint redness, first metatarsophalangeal joint (MTP1) involvement, hypertension or cardiovascular disease (angina pectoris, myocardial infarction, heart failure, cerebrovascular accident, transient ischemic attack, or peripheral vascular disease), and serum uric acid level above 5.88 mg/dL. The rule gives one point for each item. A score >8 had a positive likelihood ratio for diagnosing gout of 3.48 (TABLE1) and a higher positive predictive value (PPV) than family physicians’ clinical impressions (83% vs 64%).
The prevalence of gout in patients with scores of <4, 4 to 8, and >8 were 2.8%, 27%, and 80%, respectively. For scores of 4 to 8, the probability of gout is indeterminate, and synovial fluid analysis is recommended.
The Netherlands rule, validated in a secondary care practice of 390 patients with monoarthritis, found that a score >8 had a PPV of 87% and a score <4 had a negative predictive value of 95%.4 The probability of gout based on this rule can be calculated at http://www.umcn.nl/goutcalc.
In the study used to develop the Netherlands rule, no patients with a high probability of gout had septic arthritis. The ability of the rule to differentiate between gout and septic arthritis was tested retrospectively in 33 patients with acute gout (podagra excluded) diagnosed by the presence of monosodium urate joint crystals and 27 patients with septic arthritis diagnosed by positive bacterial culture.5 Patients with gout had significantly higher scores than patients with septic arthritis (7.8 ± 1.59 vs 3.4 ± 2.3; P<.001).
American Rheumatology Association, New York, and Rome prediction rules
A study of 82 Veterans Administration patients compared the American Rheumatology Association (ARA), New York, and Rome prediction rules with regard to their ability to diagnose gout with synovial urate crystals.6 The ARA criteria for gout diagnosis require either tophi or monosodium urate crystals in synovial fluid, or 6 out of a list of 12 other criteria.7
The New York prediction rule requires that patients meet 2 or more of the following criteria: at least 2 attacks of painful joint swelling with complete resolution within 2 weeks, podagra, tophi, and rapid response to colchicine treatment, defined as a major reduction in the objective signs of inflammation within 48 hours.
The Rome prediction rule requires meeting 2 of 3 criteria: serum uric acid >7 mg/dL in men and >6 mg/dL in women, presence of tophi, and history of attacks of painful joint swelling with abrupt onset and resolution within 2 weeks.
The New York prediction rule had the highest positive likelihood ratio of 4.4 compared with the ARA (1.8) and Rome (4.3) rules.6 The utility of the New York and Rome rules, although they have fewer criteria than ARA, is limited by the fact that they include a previous episode of joint swelling and tophi. These criteria increase their specificity but make them less useful in diagnosing a first episode of gout, when tophi are unlikely to have developed.
Prediction rules are more sensitive in established gout
The new ACR prediction rule was compared with the ARA, Rome, and New York clinical prediction rules using urate crystals as the gold standard in early (less than 2 years) and established disease (longer than 2 years).8 All clinical prediction rules were more sensitive in established disease than early disease (95.3% vs 84.1%; P<.001) and more specific in early disease than established disease (79.9% vs 52.5%; P<.001).
1. Neogi T, Jansen TL, Dalbeth N, et al. 2015 Gout Classification criteria: an American College of Rheumatology/European League Against Rheumatism collaborative initiative. Ann Rheum Dis. 2015;74:1789-1798.
2. Taylor WJ, Fransen J, Jansen TL, et al. Study for Updated Gout Classification Criteria (SUGAR): identification of features to classify gout. Arthritis Care Res (Hoboken). 2015;67:1304-1315.
3. Janssens HJ, Fransen J, van de Lisdonk EH, et al. A diagnostic rule for acute gouty arthritis in primary care without joint fluid analysis. Arch Intern Med. 2010;170:1120-1126.
4. Kienhorst LB, Janssens HJ, Fransen J, et al. The validation of a diagnostic rule for gout without joint fluid analysis: a prospective study. Rheumatology (Oxford). 2015;54:609-614.
5. Lee K, Choi ST, Kang EJ, et al. SAT0377 The performance of a novel scoring system in the differential diagnosis between acute gout and septic arthritis. Ann Rheum Dis. 2013;72:A711.
6. Malik A, Schumacher HR, Dinnella JE, et al. Clinical diagnostic criteria for gout: comparison with the gold standard of synovial fluid crystal analysis. J Clin Rheumatol. 2009;15:22.
7. Wallace SL, Robinson H, Masi AT, et al. Preliminary criteria for the classification of the acute arthritis of primary gout. Arthritis Rheum. 1977;20:895-900.
8. Taylor WJ, Fransen J, Dalbeth N, et al. Performance of classification criteria for gout in early and established disease. Ann Rheum Dis. 2016;75:178-182.
EVIDENCE-BASED ANSWER:
Clinical prediction rules effectively diagnose gout without joint fluid analysis. The American College of Rheumatology clinical prediction rules, the most accurate rules developed for research purposes, have a sensitivity of 92%, specificity of 89%, positive likelihood ratio of 8.36, and negative likelihood ratio of 0.09 (strength of recommendation [SOR]: A, prospective cohort studies).
The Netherlands criteria, developed for use in primary care, have a positive predictive value of more than 80%, a positive likelihood ratio of 3.48, and a negative likelihood ratio of 0.17 (SOR: A, prospective cohort study).
EVIDENCE SUMMARY
In 2015, the American College of Rheumatology (ACR) redefined the clinical criteria for diagnosis of gout based on a 3-step system1 that can be found at: http://goutclassificationcalculator.auckland.ac.nz. The ACR rule was derived from a cross-sectional study of 983 patients in 25 rheumatology centers in 16 countries who presented with a swollen joint.2 Of the 983 patients, 509 had gout; the prevalence was 52%. Data from 653 of these patients were used to develop the rule and then validated in the remaining 330 patients.
Compared with the gold standard of monosodium urate crystals in synovial fluid, the ACR rule has a sensitivity of 92% and a specificity of 89%. The rule, designed for the research setting, involves using synovial fluid analysis, ultrasound imaging, and radiography, which makes it less useful in a primary care setting.
The Netherlands rule for primary care
A prospective diagnostic study in 328 family medicine patients (74% male; mean age 57) with monoarthritis tested the ability of multiple clinical variables to diagnose gout using monosodium urate crystals in synovial fluid as the gold standard.3 The prevalence of gout in this population was 57%.
The best diagnostic rule (Netherlands rule) comprised the following predefined variables: male sex, previous patient-reported arthritis attack, onset within one day, joint redness, first metatarsophalangeal joint (MTP1) involvement, hypertension or cardiovascular disease (angina pectoris, myocardial infarction, heart failure, cerebrovascular accident, transient ischemic attack, or peripheral vascular disease), and serum uric acid level above 5.88 mg/dL. The rule gives one point for each item. A score >8 had a positive likelihood ratio for diagnosing gout of 3.48 (TABLE1) and a higher positive predictive value (PPV) than family physicians’ clinical impressions (83% vs 64%).
The prevalence of gout in patients with scores of <4, 4 to 8, and >8 were 2.8%, 27%, and 80%, respectively. For scores of 4 to 8, the probability of gout is indeterminate, and synovial fluid analysis is recommended.
The Netherlands rule, validated in a secondary care practice of 390 patients with monoarthritis, found that a score >8 had a PPV of 87% and a score <4 had a negative predictive value of 95%.4 The probability of gout based on this rule can be calculated at http://www.umcn.nl/goutcalc.
In the study used to develop the Netherlands rule, no patients with a high probability of gout had septic arthritis. The ability of the rule to differentiate between gout and septic arthritis was tested retrospectively in 33 patients with acute gout (podagra excluded) diagnosed by the presence of monosodium urate joint crystals and 27 patients with septic arthritis diagnosed by positive bacterial culture.5 Patients with gout had significantly higher scores than patients with septic arthritis (7.8 ± 1.59 vs 3.4 ± 2.3; P<.001).
American Rheumatology Association, New York, and Rome prediction rules
A study of 82 Veterans Administration patients compared the American Rheumatology Association (ARA), New York, and Rome prediction rules with regard to their ability to diagnose gout with synovial urate crystals.6 The ARA criteria for gout diagnosis require either tophi or monosodium urate crystals in synovial fluid, or 6 out of a list of 12 other criteria.7
The New York prediction rule requires that patients meet 2 or more of the following criteria: at least 2 attacks of painful joint swelling with complete resolution within 2 weeks, podagra, tophi, and rapid response to colchicine treatment, defined as a major reduction in the objective signs of inflammation within 48 hours.
The Rome prediction rule requires meeting 2 of 3 criteria: serum uric acid >7 mg/dL in men and >6 mg/dL in women, presence of tophi, and history of attacks of painful joint swelling with abrupt onset and resolution within 2 weeks.
The New York prediction rule had the highest positive likelihood ratio of 4.4 compared with the ARA (1.8) and Rome (4.3) rules.6 The utility of the New York and Rome rules, although they have fewer criteria than ARA, is limited by the fact that they include a previous episode of joint swelling and tophi. These criteria increase their specificity but make them less useful in diagnosing a first episode of gout, when tophi are unlikely to have developed.
Prediction rules are more sensitive in established gout
The new ACR prediction rule was compared with the ARA, Rome, and New York clinical prediction rules using urate crystals as the gold standard in early (less than 2 years) and established disease (longer than 2 years).8 All clinical prediction rules were more sensitive in established disease than early disease (95.3% vs 84.1%; P<.001) and more specific in early disease than established disease (79.9% vs 52.5%; P<.001).
1. Neogi T, Jansen TL, Dalbeth N, et al. 2015 Gout Classification criteria: an American College of Rheumatology/European League Against Rheumatism collaborative initiative. Ann Rheum Dis. 2015;74:1789-1798.
2. Taylor WJ, Fransen J, Jansen TL, et al. Study for Updated Gout Classification Criteria (SUGAR): identification of features to classify gout. Arthritis Care Res (Hoboken). 2015;67:1304-1315.
3. Janssens HJ, Fransen J, van de Lisdonk EH, et al. A diagnostic rule for acute gouty arthritis in primary care without joint fluid analysis. Arch Intern Med. 2010;170:1120-1126.
4. Kienhorst LB, Janssens HJ, Fransen J, et al. The validation of a diagnostic rule for gout without joint fluid analysis: a prospective study. Rheumatology (Oxford). 2015;54:609-614.
5. Lee K, Choi ST, Kang EJ, et al. SAT0377 The performance of a novel scoring system in the differential diagnosis between acute gout and septic arthritis. Ann Rheum Dis. 2013;72:A711.
6. Malik A, Schumacher HR, Dinnella JE, et al. Clinical diagnostic criteria for gout: comparison with the gold standard of synovial fluid crystal analysis. J Clin Rheumatol. 2009;15:22.
7. Wallace SL, Robinson H, Masi AT, et al. Preliminary criteria for the classification of the acute arthritis of primary gout. Arthritis Rheum. 1977;20:895-900.
8. Taylor WJ, Fransen J, Dalbeth N, et al. Performance of classification criteria for gout in early and established disease. Ann Rheum Dis. 2016;75:178-182.
Evidence-based answers from the Family Physicians Inquiries Network
Do corticosteroid injections improve carpal tunnel syndrome symptoms?
Yes. Injected corticosteroids reduce symptoms of carpal tunnel syndrome (CTS) more effectively than placebo or systemic steroids, but no better than anti-inflammatory medication and splinting, from one to 12 weeks after therapy (strength of recommendation [SOR]: A, meta-analysis of randomized controlled trials [RCTs] and consistent RCT).
A 40-mg injection of methylprednisolone reduces symptoms as effectively as an 80-mg injection for as long as 10 weeks, but the 80-mg dose reduces progression to surgery at one year (SOR: B, RCT). Long-term effects of injections decrease by 12 months (SOR: B, RCT).
After corticosteroid injections, 14% of patients proceed to surgery at one year, and 33% proceed to surgery at 5 years (SOR: B, cohort trial).
EVIDENCE SUMMARY
A 2007 Cochrane review of 12 RCTs with 671 patients compared the efficacy of corticosteroid injections for CTS with placebo injections or other nonsurgical interventions.1 Patients who received corticosteroid injections showed clinical improvement at one month or less compared with placebo (2 trials, 141 patients; 73% corticosteroids vs 28% placebo; relative risk [RR]=2.58; 95% confidence interval [CI], 1.72-3.87; number needed to treat [NNT]=2).
Compared with systemic corticosteroids, corticosteroid injections didn’t improve symptoms on a Global Symptom Score (scale of 0-50, with 50 indicating the most severe symptoms) at 2 weeks (one trial, 60 patients; mean difference [MD]= −4.2; 95% CI, −8.7 to 0.26), but did improve symptoms at 8 weeks (MD= −7.16; 95% CI, −11.5 to −2.86) and 12 weeks (MD= −7.1; 95% CI, −11.7 to −2.52).
Patients showed no difference in scores between corticosteroid injection and oral anti-inflammatory medication with neutral angle wrist splints on the Symptom Severity Scale (1 to 5, with 5 indicating the most severe symptoms) at 2 weeks (1 trial, 23 patients [37 wrists]; MD=0.0; 95% CI, −0.64 to 0.64) or 8 weeks (MD=0.1; 95% CI, −0.33 to 0.53).
Higher corticosteroid dose reduces surgery at one year
A 2013 high-quality RCT with 111 patients assessed pain relief and rates of surgery at one year with local corticosteroid injections for CTS.2 This trial had 3 arms with 37 patients in each: 80-mg methylprednisolone injection, 40-mg methylprednisolone injection, or placebo injection.
Both corticosteroid groups showed greater improvement on the Symptom Severity Scale at 10 weeks compared with placebo (40-mg methylprednisolone group: MD= −0.88; 95% CI, −1.3 to −0.46; 80-mg methylprednisolone group: MD= −0.64; 95% CI, −1.06 to −0.21). There was no difference between the methylprednisolone groups.
The incidence of surgery at one year was lower in the 80-mg methylprednisolone group compared with placebo (73% vs 92%; RR=0.79; 95% CI, 0.64-0.99; NNT=5) but not in the 40-mg methylprednisolone group compared with placebo (81% vs 92%; RR=0.88; 95% CI, 0.73-1.06).
Corticosteroids improve symptoms and disability, but effects wear off
A randomized double-blind, placebo-controlled trial conducted in 2010 examined the effectiveness of corticosteroid injections given by general practitioners to 69 patients with CTS.3 Patients were randomized to receive 10 mg of either triamcinolone or saline. They were reassessed after one week, and patients in the saline injection group who had inadequate symptom relief received a triamcinolone injection as bail-out treatment. Follow-up by patient questionnaire was done at 1, 3, 6, and 12 months.
Investigators assessed symptoms and disability using the Symptom Severity Scale and Functional Disability Scale, which are part of the Boston Carpal Tunnel Questionnaire. Like the Symptom Severity Scale, the Functional Disability Scale is scored from 1 to 5, with higher scores indicating more severe disability.
One week after treatment, the corticosteroid group showed greater improvement in symptom severity and functional disability than the saline group (symptom severity decreased from 2.9 to 1.9 with triamcinolone vs 2.8 to 2.5 with saline; MD=0.64; 95% CI, 0.32-0.96; functional disability decreased from 2.5 to 1.9 with triamcinolone but remained at 2.4 with saline; MD=0.59; 95% CI, 0.23-0.94).
Long-term follow-up of 35 patients who responded to corticosteroid injections found that the effects wore off over 12 months when assessed using the Symptom Severity Scale (mean score 1.5 at 1 month, 2.0 at 12 months; P=.08).
Surgery rates at one and 5 years
A 2012 prospective cohort study examined the 5-year rate of surgical intervention after a 20-mg methylprednisolone injection in 824 patients diagnosed with CTS who had failed conservative treatment.4 A total of 500 patients had a relapse of symptoms, and 372 of them elected to have a second injection. A Kaplan-Meier survivorship analysis determined rates of surgical intervention to be 14.5% (95% CI, 11.9-17) at one year and 33.2% (95% CI, 28.7-37.8) at 5 years.
RECOMMENDATION
A 2010 American Academy of Orthopaedic Surgeons evidence-based practice guideline on the treatment of CTS recommends corticosteroid injection before considering surgery (Grade B, Level 1 suggested recommendation with good evidence).5
1. Marshall S, Tardif G, Ashworth N. Local corticosteroid injection for carpal tunnel syndrome. Cochrane Database Syst Rev. 2007;(2):CD001554.
2. Atroshi I, Flondell M, Hofer M, et al. Methylprednisolone injections for the carpal tunnel syndrome: a randomized, placebo-controlled trial. Ann Intern Med. 2013;159:309-317.
3. Peters-Veluthamaningal C, Winters JC, Gronier KH, et al. Randomised controlled trial of local corticosteroid injections for carpal tunnel syndrome in general practice. BMC Fam Pract. 2010;11:54.
4. Jenkins PJ, Duckworth AD, Watts AC, et al. Corticosteroid injection for carpal tunnel syndrome: a 5-year survivorship analysis. Hand. 2012;7:151-156.
5. Keith MW, Masear V, Chung KC, et al. American Academy of Orthopaedic Surgeons clinical practice guideline on the treatment of carpal tunnel syndrome. J Bone Joint Surg Am. 2010;92:218-219.
Yes. Injected corticosteroids reduce symptoms of carpal tunnel syndrome (CTS) more effectively than placebo or systemic steroids, but no better than anti-inflammatory medication and splinting, from one to 12 weeks after therapy (strength of recommendation [SOR]: A, meta-analysis of randomized controlled trials [RCTs] and consistent RCT).
A 40-mg injection of methylprednisolone reduces symptoms as effectively as an 80-mg injection for as long as 10 weeks, but the 80-mg dose reduces progression to surgery at one year (SOR: B, RCT). Long-term effects of injections decrease by 12 months (SOR: B, RCT).
After corticosteroid injections, 14% of patients proceed to surgery at one year, and 33% proceed to surgery at 5 years (SOR: B, cohort trial).
EVIDENCE SUMMARY
A 2007 Cochrane review of 12 RCTs with 671 patients compared the efficacy of corticosteroid injections for CTS with placebo injections or other nonsurgical interventions.1 Patients who received corticosteroid injections showed clinical improvement at one month or less compared with placebo (2 trials, 141 patients; 73% corticosteroids vs 28% placebo; relative risk [RR]=2.58; 95% confidence interval [CI], 1.72-3.87; number needed to treat [NNT]=2).
Compared with systemic corticosteroids, corticosteroid injections didn’t improve symptoms on a Global Symptom Score (scale of 0-50, with 50 indicating the most severe symptoms) at 2 weeks (one trial, 60 patients; mean difference [MD]= −4.2; 95% CI, −8.7 to 0.26), but did improve symptoms at 8 weeks (MD= −7.16; 95% CI, −11.5 to −2.86) and 12 weeks (MD= −7.1; 95% CI, −11.7 to −2.52).
Patients showed no difference in scores between corticosteroid injection and oral anti-inflammatory medication with neutral angle wrist splints on the Symptom Severity Scale (1 to 5, with 5 indicating the most severe symptoms) at 2 weeks (1 trial, 23 patients [37 wrists]; MD=0.0; 95% CI, −0.64 to 0.64) or 8 weeks (MD=0.1; 95% CI, −0.33 to 0.53).
Higher corticosteroid dose reduces surgery at one year
A 2013 high-quality RCT with 111 patients assessed pain relief and rates of surgery at one year with local corticosteroid injections for CTS.2 This trial had 3 arms with 37 patients in each: 80-mg methylprednisolone injection, 40-mg methylprednisolone injection, or placebo injection.
Both corticosteroid groups showed greater improvement on the Symptom Severity Scale at 10 weeks compared with placebo (40-mg methylprednisolone group: MD= −0.88; 95% CI, −1.3 to −0.46; 80-mg methylprednisolone group: MD= −0.64; 95% CI, −1.06 to −0.21). There was no difference between the methylprednisolone groups.
The incidence of surgery at one year was lower in the 80-mg methylprednisolone group compared with placebo (73% vs 92%; RR=0.79; 95% CI, 0.64-0.99; NNT=5) but not in the 40-mg methylprednisolone group compared with placebo (81% vs 92%; RR=0.88; 95% CI, 0.73-1.06).
Corticosteroids improve symptoms and disability, but effects wear off
A randomized double-blind, placebo-controlled trial conducted in 2010 examined the effectiveness of corticosteroid injections given by general practitioners to 69 patients with CTS.3 Patients were randomized to receive 10 mg of either triamcinolone or saline. They were reassessed after one week, and patients in the saline injection group who had inadequate symptom relief received a triamcinolone injection as bail-out treatment. Follow-up by patient questionnaire was done at 1, 3, 6, and 12 months.
Investigators assessed symptoms and disability using the Symptom Severity Scale and Functional Disability Scale, which are part of the Boston Carpal Tunnel Questionnaire. Like the Symptom Severity Scale, the Functional Disability Scale is scored from 1 to 5, with higher scores indicating more severe disability.
One week after treatment, the corticosteroid group showed greater improvement in symptom severity and functional disability than the saline group (symptom severity decreased from 2.9 to 1.9 with triamcinolone vs 2.8 to 2.5 with saline; MD=0.64; 95% CI, 0.32-0.96; functional disability decreased from 2.5 to 1.9 with triamcinolone but remained at 2.4 with saline; MD=0.59; 95% CI, 0.23-0.94).
Long-term follow-up of 35 patients who responded to corticosteroid injections found that the effects wore off over 12 months when assessed using the Symptom Severity Scale (mean score 1.5 at 1 month, 2.0 at 12 months; P=.08).
Surgery rates at one and 5 years
A 2012 prospective cohort study examined the 5-year rate of surgical intervention after a 20-mg methylprednisolone injection in 824 patients diagnosed with CTS who had failed conservative treatment.4 A total of 500 patients had a relapse of symptoms, and 372 of them elected to have a second injection. A Kaplan-Meier survivorship analysis determined rates of surgical intervention to be 14.5% (95% CI, 11.9-17) at one year and 33.2% (95% CI, 28.7-37.8) at 5 years.
RECOMMENDATION
A 2010 American Academy of Orthopaedic Surgeons evidence-based practice guideline on the treatment of CTS recommends corticosteroid injection before considering surgery (Grade B, Level 1 suggested recommendation with good evidence).5
1. Marshall S, Tardif G, Ashworth N. Local corticosteroid injection for carpal tunnel syndrome. Cochrane Database Syst Rev. 2007;(2):CD001554.
2. Atroshi I, Flondell M, Hofer M, et al. Methylprednisolone injections for the carpal tunnel syndrome: a randomized, placebo-controlled trial. Ann Intern Med. 2013;159:309-317.
3. Peters-Veluthamaningal C, Winters JC, Gronier KH, et al. Randomised controlled trial of local corticosteroid injections for carpal tunnel syndrome in general practice. BMC Fam Pract. 2010;11:54.
4. Jenkins PJ, Duckworth AD, Watts AC, et al. Corticosteroid injection for carpal tunnel syndrome: a 5-year survivorship analysis. Hand. 2012;7:151-156.
5. Keith MW, Masear V, Chung KC, et al. American Academy of Orthopaedic Surgeons clinical practice guideline on the treatment of carpal tunnel syndrome. J Bone Joint Surg Am. 2010;92:218-219.
Evidence-based answers from the Family Physicians Inquiries Network

Which interventions can increase breastfeeding duration?
Breastfeeding support, beyond standard care, from lay people or professionals increases both short- and long-term breastfeeding duration (strength of recommendation: B, meta-analyses of randomized controlled trials [RCTs] with demonstrated heterogeneity).
EVIDENCE SUMMARY
A 2012 Cochrane review of 52 studies (44 RCTs and 8 cluster-randomized trials; N=56,451) assessed the overall effectiveness of multiple supportive measures on decreasing cessation of “any” (partial and exclusive) and “exclusive” breastfeeding compared with usual care.1 Participants were healthy breastfeeding mothers of healthy term babies. Support interventions were defined broadly but included individual and group interactions, as well as contact in person or over the phone by professionals or lay volunteers. Patients were approached proactively or reactively upon request, and the interventions occurred one or more times.
The interventions reduced discontinuation rates among both “exclusive” and “any” breastfeeding mothers (TABLE1). The review found lay and professional support to be equally effective at promoting continuation of breastfeeding. Limitations include a moderate to high amount of heterogeneity, as well as the inherent difficulty of blinding subjects in the studies.
Lay support can make a significant difference in the short term
A 2008 systematic review of 38 RCTs (N=29,020) compared any counseling or behavioral intervention initiated from a clinician’s practice (office or hospital) with usual care.2 The review excluded community and peer-initiated interventions. The reviewers defined breastfeeding duration as follows: initiation (up to 2 weeks), short-term (one to 3 months), intermediate-term (4 to 5 months), long-term (6 to 8 months), and prolonged (9 or more months). Investigators also analyzed breastfeeding rates by “exclusive” and “nonexclusive” (formula supplementation) regimens.
For nonexclusive breastfeeding, the review found interventions to promote breastfeeding improved rates only at initiation (18 RCTs, N=7688; relative risk [RR] for cessation of breastfeeding=1.04; 95% confidence interval [CI], 1.0-1.08; number needed to treat [NNT]=38) and in the short term (18 RCTs, N= 19,358; RR=1.10; 95% CI, 1.02-1.19; NNT=7). For exclusive breastfeeding, interventions improved rates only in the short term (17 RCTs, N=20,552; RR=1.72; 95% CI, 1.0-2.97; NNT=3).
The review found that lay support (defined as counseling or social support from peers) but not professional support was significantly associated with improving rates of both “nonexclusive” and “exclusive’ breastfeeding, but only over the short term (5 RCTs, N not provided; RR=1.22; 95% CI, 1.08-1.37; and 4 RCTs, N not provided; RR=1.65; 95% CI, 1.03-2.63; respectively). As with the Cochrane review, the results for all study groups demonstrated moderate to significant heterogeneity.
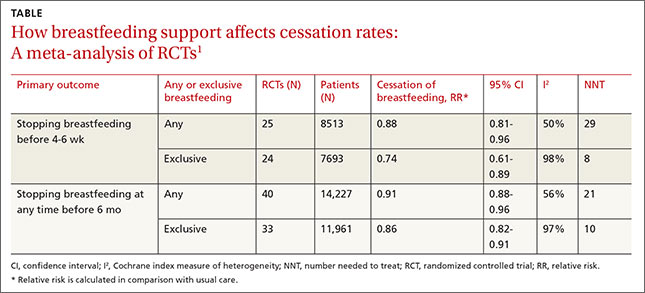
RECOMMENDATIONS
The Surgeon General, the American Academy of Family Physicians, the American Academy of Pediatrics, and the American College of Obstetricians and Gynecologists all recommend that women be educated about the benefits of breastfeeding and receive supportive interventions before and after delivery.3-6
1. Renfrew MJ, McCormick FM, Wade A, et al. Support for healthy breastfeeding mothers with healthy term babies. Cochrane Database Syst Rev. 2012;5:CD001141.
2. Chung M, Raman G, Trikalinos T, et al. Interventions in primary care to promote breastfeeding: an evidence review for the U.S. Preventive Services Task Force. Ann Intern Med. 2008;149:565-582.
3. United States Department of Health and Human Services. The Surgeon General’s Call to Action to Support Breastfeeding. US Department of Health and Human Services, Office of the Surgeon General Web site. Available at: http://www.surgeongeneral.gov/library/calls/breastfeeding/. Accessed January 19, 2015.
4. American Academy of Family Physicians. Breastfeeding, Family Physicians Supporting (Position Paper). American Academy of Family Physicians Web site. Available at: http://www.aafp.org/about/policies/all/breastfeeding-support.html (updated Nov. 4, 2014). Accessed January 19, 2015.
5. Johnson M, Landers S, Noble L, et al. American Academy of Pediatrics, Section on Breastfeeding. Policy Statement: Breastfeeding and the use of human milk. Pediatrics. 2012;129:e827–e841.
6. Committee on Health Care for Underserved Women, American College of Obstetricians and Gynecologists. ACOG Committee Opinion No. 361: Breastfeeding: maternal and infant aspects. Obstet Gynecol. 2007;109(2 Pt 1):479-480.
Breastfeeding support, beyond standard care, from lay people or professionals increases both short- and long-term breastfeeding duration (strength of recommendation: B, meta-analyses of randomized controlled trials [RCTs] with demonstrated heterogeneity).
EVIDENCE SUMMARY
A 2012 Cochrane review of 52 studies (44 RCTs and 8 cluster-randomized trials; N=56,451) assessed the overall effectiveness of multiple supportive measures on decreasing cessation of “any” (partial and exclusive) and “exclusive” breastfeeding compared with usual care.1 Participants were healthy breastfeeding mothers of healthy term babies. Support interventions were defined broadly but included individual and group interactions, as well as contact in person or over the phone by professionals or lay volunteers. Patients were approached proactively or reactively upon request, and the interventions occurred one or more times.
The interventions reduced discontinuation rates among both “exclusive” and “any” breastfeeding mothers (TABLE1). The review found lay and professional support to be equally effective at promoting continuation of breastfeeding. Limitations include a moderate to high amount of heterogeneity, as well as the inherent difficulty of blinding subjects in the studies.
Lay support can make a significant difference in the short term
A 2008 systematic review of 38 RCTs (N=29,020) compared any counseling or behavioral intervention initiated from a clinician’s practice (office or hospital) with usual care.2 The review excluded community and peer-initiated interventions. The reviewers defined breastfeeding duration as follows: initiation (up to 2 weeks), short-term (one to 3 months), intermediate-term (4 to 5 months), long-term (6 to 8 months), and prolonged (9 or more months). Investigators also analyzed breastfeeding rates by “exclusive” and “nonexclusive” (formula supplementation) regimens.
For nonexclusive breastfeeding, the review found interventions to promote breastfeeding improved rates only at initiation (18 RCTs, N=7688; relative risk [RR] for cessation of breastfeeding=1.04; 95% confidence interval [CI], 1.0-1.08; number needed to treat [NNT]=38) and in the short term (18 RCTs, N= 19,358; RR=1.10; 95% CI, 1.02-1.19; NNT=7). For exclusive breastfeeding, interventions improved rates only in the short term (17 RCTs, N=20,552; RR=1.72; 95% CI, 1.0-2.97; NNT=3).
The review found that lay support (defined as counseling or social support from peers) but not professional support was significantly associated with improving rates of both “nonexclusive” and “exclusive’ breastfeeding, but only over the short term (5 RCTs, N not provided; RR=1.22; 95% CI, 1.08-1.37; and 4 RCTs, N not provided; RR=1.65; 95% CI, 1.03-2.63; respectively). As with the Cochrane review, the results for all study groups demonstrated moderate to significant heterogeneity.
RECOMMENDATIONS
The Surgeon General, the American Academy of Family Physicians, the American Academy of Pediatrics, and the American College of Obstetricians and Gynecologists all recommend that women be educated about the benefits of breastfeeding and receive supportive interventions before and after delivery.3-6
1. Renfrew MJ, McCormick FM, Wade A, et al. Support for healthy breastfeeding mothers with healthy term babies. Cochrane Database Syst Rev. 2012;5:CD001141.
2. Chung M, Raman G, Trikalinos T, et al. Interventions in primary care to promote breastfeeding: an evidence review for the U.S. Preventive Services Task Force. Ann Intern Med. 2008;149:565-582.
3. United States Department of Health and Human Services. The Surgeon General’s Call to Action to Support Breastfeeding. US Department of Health and Human Services, Office of the Surgeon General Web site. Available at: http://www.surgeongeneral.gov/library/calls/breastfeeding/. Accessed January 19, 2015.
4. American Academy of Family Physicians. Breastfeeding, Family Physicians Supporting (Position Paper). American Academy of Family Physicians Web site. Available at: http://www.aafp.org/about/policies/all/breastfeeding-support.html (updated Nov. 4, 2014). Accessed January 19, 2015.
5. Johnson M, Landers S, Noble L, et al. American Academy of Pediatrics, Section on Breastfeeding. Policy Statement: Breastfeeding and the use of human milk. Pediatrics. 2012;129:e827–e841.
6. Committee on Health Care for Underserved Women, American College of Obstetricians and Gynecologists. ACOG Committee Opinion No. 361: Breastfeeding: maternal and infant aspects. Obstet Gynecol. 2007;109(2 Pt 1):479-480.
Evidence-based answers from the Family Physicians Inquiries Network
How do we evaluate a marginally low B12 level?
The best way to evaluate a low-normal B12 level is to check serum methylmalonic acid and homocysteine levels1 (strength of recommendation [SOR]: B, based on consistent level 2 or 3 studies). Give 1 or 2 mg of oral vitamin B12 a day if levels are marginally low and either methylmalonic acid or both methylmalonic acid and homocysteine are elevated (SOR: A).
When faced with low-normal serum B12, either further evaluation or empiric treatment is warranted
Robert C. Oh, MD, MPH
Tripler Army Medical Center, Honolulu, Hawaii
With the advent of methylmalonic acid, homocysteine testing, and the proven efficacy of oral B12, medicine has come a long way from shilling tests and monthly intramuscular shots in the diagnosis and management of B12 deficiency. “Normal” serum B12 may not accurately reflect true tissue B12 stores. Therefore, if serum B12 is borderline low, I routinely get methylmalonic acid and homocysteine for patients in whom I need to “prove” deficiency (for myself, patients, or third-party agents) or monitor closely (ie, those with neurologic symptoms).
Once Deficiency is confirmed, search for a cause. Since 1000 mcg of oral B12 treats nearly all causes of B12 deficiency (including pernicious anemia and deficiency from gastric bypass surgery), empiric treatment is a reasonable alternative as long as serum B12 and symptoms are monitored for therapeutic response. Bottom line: since early detection and treatment could potentially prevent permanent neurologic sequelae, when faced with a low-normal serum B12, it should not be dismissed as “normal”—either further evaluation or empiric treatment is warranted.
Evidence Summary
A low-normal B12 level is 150 to 350 pg/mL. Levels less than 150 pg/mL indicate deficiency. Levels greater than 350 pg/mL indicate adequate B12 supply.2
Vitamin B12 is a necessary coenzyme in the metabolism of methylmalonic acid to succinyl choline, and is also a necessary coenzyme with folate in the metabolism of homocysteine to methionine. Therefore, a vitamin B12 deficiency leads to elevated levels of unmetabolized methylmalonic acid and homocysteine. At a local lab the normal range of methylmalonic acid is 0.00 to 0.40 umol/L, and homocysteine’s normal range is 4.0 to 10.0 mmol/L. Normal levels might vary by laboratory. Other conditions, such as renal insufficiency, may also cause elevation of methylmalonic acid and homocysteine.3
Holotranscobalamin may become a first-choice assay for diagnosing early vitamin B12 deficiency. Studies have shown that it compares favorably with current combined measures (B12 levels, methylmalonic acid, homocysteine). Like current assays, holotranscobalamin is also affected by renal function. It requires further investigation to establish relevant cutoff levels before it can be recommended as a diagnostic strategy.4
Oral vitamin B12 at doses of 1000 to 2000 mcg/d is a simple and cost-effective treatment option for any B12-deficient person, and may actually be superior to intramuscular replacement.5,6 A Cochrane Collaboration review of oral vitamin B12 replacement found that these high doses seemed as effective as intramuscular vitamin B12 in all B12-deficient patients—even those with pernicious anemia, Crohn’s disease, ileal resection, or malabsorption states. The authors of the review recommend a “further large, pragmatic trial in a primary care setting” to determine whether oral vitamin B12 is effective for patients with major common cases of malabsorption and to provide additional evidence for cost effectiveness.6
Recommendations from Others
Current guidelines recommend giving vitamin B12 if methylmalonic acid or both methylmalonic acid and homocysteine are elevated. Give folate if only homocysteine is elevated. Give vitamin B12 if homocysteine elevation persists in spite of adequate folate replacement.2
Monitor for correction of low-normal B12 and metabolites with follow-up blood test after 1 to 2 months of treatment. The negative predictive value of normal metabolites (methylmalonic acid and homocysteine) is unknown.
Individuals with normal vitamin B12 levels and metabolites but significant B12 deficiency signs and symptoms have responded dramatically to B12 replacement.7 Therefore, it is reasonable to treat and monitor for response as an alternative approach to the evaluation of a low-normal B12 level. Pennypacker et al2 state that “the ultimate gold standard for vitamin B12 deficiency may be the reduction in homocysteine and methylmalonic acid concentrations and improvement in clinical symptoms or signs in response to vitamin B12 treatment.”
1. Clarke R, Refsum H, Birks J, et al. Screening for vitamin B-12 and folate deficiency in older persons. Am J Clin Nutr 2003;77:1241-1247.
2. Pennypacker LC, Allen RH, Kelly JP, et al. High prevalence of cobalamin deficiency in elderly out-patients. J Am Geriatr Soc 1992;40:1197-1204.
3. Hvas AM, Juul S, Gerdes LU, Nexo E. The marker of cobalamin deficiency, plasma methylmalonic acid, correlates to plasma creatinine. J Intern Med 2000;247:507-512.
4. Hvas AM, Nexo E. Holotranscobalamin—a first choice assay for diagnosing early vitamin B deficiency? J Intern Med 2005;257:289-298.
5. Kuzminski AM, Del Giacco EJ, Sllen RH, Stabler SP, Lindenbaum J. Effective treatment of cobalamin deficiency with oral cobalamin. Blood 1998;92:1191-1198.
6. Vidal-Alaball J, Butler CC, Cannings-John R, et al. Oral vitamin B12 versus intramuscular vitamin B12 for vitamin B12 deficiency. Cochrane Database Syst Rev 2005;(3):CD004655.
7. Solomon LR. Cobalamin-responsive disorders in the ambulatory care setting: unreliability of cobalamin, methylmalonic acid, and homocysteine testing. Blood 2005;105:978-985.
The best way to evaluate a low-normal B12 level is to check serum methylmalonic acid and homocysteine levels1 (strength of recommendation [SOR]: B, based on consistent level 2 or 3 studies). Give 1 or 2 mg of oral vitamin B12 a day if levels are marginally low and either methylmalonic acid or both methylmalonic acid and homocysteine are elevated (SOR: A).
When faced with low-normal serum B12, either further evaluation or empiric treatment is warranted
Robert C. Oh, MD, MPH
Tripler Army Medical Center, Honolulu, Hawaii
With the advent of methylmalonic acid, homocysteine testing, and the proven efficacy of oral B12, medicine has come a long way from shilling tests and monthly intramuscular shots in the diagnosis and management of B12 deficiency. “Normal” serum B12 may not accurately reflect true tissue B12 stores. Therefore, if serum B12 is borderline low, I routinely get methylmalonic acid and homocysteine for patients in whom I need to “prove” deficiency (for myself, patients, or third-party agents) or monitor closely (ie, those with neurologic symptoms).
Once Deficiency is confirmed, search for a cause. Since 1000 mcg of oral B12 treats nearly all causes of B12 deficiency (including pernicious anemia and deficiency from gastric bypass surgery), empiric treatment is a reasonable alternative as long as serum B12 and symptoms are monitored for therapeutic response. Bottom line: since early detection and treatment could potentially prevent permanent neurologic sequelae, when faced with a low-normal serum B12, it should not be dismissed as “normal”—either further evaluation or empiric treatment is warranted.
Evidence Summary
A low-normal B12 level is 150 to 350 pg/mL. Levels less than 150 pg/mL indicate deficiency. Levels greater than 350 pg/mL indicate adequate B12 supply.2
Vitamin B12 is a necessary coenzyme in the metabolism of methylmalonic acid to succinyl choline, and is also a necessary coenzyme with folate in the metabolism of homocysteine to methionine. Therefore, a vitamin B12 deficiency leads to elevated levels of unmetabolized methylmalonic acid and homocysteine. At a local lab the normal range of methylmalonic acid is 0.00 to 0.40 umol/L, and homocysteine’s normal range is 4.0 to 10.0 mmol/L. Normal levels might vary by laboratory. Other conditions, such as renal insufficiency, may also cause elevation of methylmalonic acid and homocysteine.3
Holotranscobalamin may become a first-choice assay for diagnosing early vitamin B12 deficiency. Studies have shown that it compares favorably with current combined measures (B12 levels, methylmalonic acid, homocysteine). Like current assays, holotranscobalamin is also affected by renal function. It requires further investigation to establish relevant cutoff levels before it can be recommended as a diagnostic strategy.4
Oral vitamin B12 at doses of 1000 to 2000 mcg/d is a simple and cost-effective treatment option for any B12-deficient person, and may actually be superior to intramuscular replacement.5,6 A Cochrane Collaboration review of oral vitamin B12 replacement found that these high doses seemed as effective as intramuscular vitamin B12 in all B12-deficient patients—even those with pernicious anemia, Crohn’s disease, ileal resection, or malabsorption states. The authors of the review recommend a “further large, pragmatic trial in a primary care setting” to determine whether oral vitamin B12 is effective for patients with major common cases of malabsorption and to provide additional evidence for cost effectiveness.6
Recommendations from Others
Current guidelines recommend giving vitamin B12 if methylmalonic acid or both methylmalonic acid and homocysteine are elevated. Give folate if only homocysteine is elevated. Give vitamin B12 if homocysteine elevation persists in spite of adequate folate replacement.2
Monitor for correction of low-normal B12 and metabolites with follow-up blood test after 1 to 2 months of treatment. The negative predictive value of normal metabolites (methylmalonic acid and homocysteine) is unknown.
Individuals with normal vitamin B12 levels and metabolites but significant B12 deficiency signs and symptoms have responded dramatically to B12 replacement.7 Therefore, it is reasonable to treat and monitor for response as an alternative approach to the evaluation of a low-normal B12 level. Pennypacker et al2 state that “the ultimate gold standard for vitamin B12 deficiency may be the reduction in homocysteine and methylmalonic acid concentrations and improvement in clinical symptoms or signs in response to vitamin B12 treatment.”
1. Clarke R, Refsum H, Birks J, et al. Screening for vitamin B-12 and folate deficiency in older persons. Am J Clin Nutr 2003;77:1241-1247.
2. Pennypacker LC, Allen RH, Kelly JP, et al. High prevalence of cobalamin deficiency in elderly out-patients. J Am Geriatr Soc 1992;40:1197-1204.
3. Hvas AM, Juul S, Gerdes LU, Nexo E. The marker of cobalamin deficiency, plasma methylmalonic acid, correlates to plasma creatinine. J Intern Med 2000;247:507-512.
4. Hvas AM, Nexo E. Holotranscobalamin—a first choice assay for diagnosing early vitamin B deficiency? J Intern Med 2005;257:289-298.
5. Kuzminski AM, Del Giacco EJ, Sllen RH, Stabler SP, Lindenbaum J. Effective treatment of cobalamin deficiency with oral cobalamin. Blood 1998;92:1191-1198.
6. Vidal-Alaball J, Butler CC, Cannings-John R, et al. Oral vitamin B12 versus intramuscular vitamin B12 for vitamin B12 deficiency. Cochrane Database Syst Rev 2005;(3):CD004655.
7. Solomon LR. Cobalamin-responsive disorders in the ambulatory care setting: unreliability of cobalamin, methylmalonic acid, and homocysteine testing. Blood 2005;105:978-985.
Evidence-based answers from the Family Physicians Inquiries Network
Does psychiatric treatment help patients with intractable chronic pain?
Tricyclic antidepressants and intensive multi-disciplinary programs are moderately effective for reducing chronic back pain; tricyclics are also effective for diabetic neuropathy and irritable bowel syndrome (strength of recommendation [SOR]: A, meta-analyses and multiple small randomized controlled trials).
Cognitive therapies are modestly effective for reducing pain in the following: chronic back pain, other chronic musculoskeletal disorders including rheumatoid arthritis (SOR: B, multiple meta-analyses with significant heterogeneity), and for chronic cancer pain (SOR: B, 1 meta-analysis of various quality studies).
Consider tricyclics for all chronic pain sufferers without a contraindication
Stan Sherman, MD
Oklahoma State University, Tulsa
Dealing with issues of chronic pain is frustrating for both clinicians and patients. With inability to relieve the patient’s pain, confounding factors of medication overuse, noncompliance, and secondary gain or malingering often cloud the clinical picture. Add to this the high rate of comorbid depression, and it makes sense to use behavioral services in treating patient’s pain.
But does it really help? The evidence indicates that behavioral treatment helps some, but it depends who is doing the treating, and the intensity of the therapy. By far the easiest evidence to put into practice is the use of tricyclic antidepressants, which should probably be prescribed to all chronic pain sufferers who do not have a medical contraindication, such as suicide risk or heart disease.
Evidence summary
Amitriptyline and other tricyclic and tetracyclic antidepressants moderately improve pain control for patients with chronic back pain.1,2 The pain reduction was independent of the presence of depression, although patients who were depressed had a significant improvement in mood. The outcome on chronic pain of antidepressants with serotonin and norepinephrine reuptake inhibitory activity is still being evaluated. It appears that those with only SSRI activity are not effective improving chronic pain.2
Tricyclics are effective for diabetic neuropathy (number needed to treat [NNT]=3.5 for 50% reduction of pain),3 and they are effective for reducing pain but not for global symptoms in irritable bowel syndrome.4 Amitriptyline reduces the pain of diabetic peripheral neuropathy in a dose related manner up to 150 mg/d, although much lower doses are often effective and cause fewer anticholinergic side-effects.
For chronic back pain, a Cochrane review including 1964 patients found strong evidence for pain reduction and modest evidence for functional improvement from intensive (>100 hours) multidisciplinary biopsychosocial rehabilitation. Less intense and less comprehensive psychophysical programs did not reduce pain or improve function.5 It was unclear if the intensive programs were generalizable. Another review found that cognitive and progressive relaxation therapy had a moderate effect on short-term pain control vs waiting-list controls for chronic back pain. However, only a third of the studies were of “high quality,” and the total number of patients in the relaxation analysis was 39.6
A systematic review of 25 studies (1672 patients) found significant effect sizes for cognitive therapies in reducing pain and other symptoms in chronic musculoskeletal pain, including rheumatoid arthritis, fibromyalgia, back, and other pain syndromes.7 However, many of the trials were small or taken from “samples of convenience” from rehabilitation and pain clinics, and most lacked documentation of randomization. For rheumatoid arthritis alone, a systematic review of 19 studies found cognitive therapies had a small but statistically significant effect on pain, functional disability, depression, coping, and self-efficacy for 1298 patients at initial follow-up. However, only “tender points” and coping remained improved at subsequent follow-ups averaging 8.5 months.8
In adults with cancer pain, a recent meta-analysis of 1723 patients showed modest but significant effects on pain from psycho-educational interventions in 25 studies.9 Although just 3 of the studies lasted 52 weeks or longer, effects were found from good-quality studies for “relaxation-promoting,” educational, and supportive counseling plus content therapies.
A significant confounder in many of these studies may be that some treatments seem more effective in secondary care than in primary care settings, as based on a systemic review of interventions for somatic symptoms in primary care.10
Recommendations from others
The NIH states that antidepressants are effective adjuvants in pain management, and that cognitive-behavioral treatments may be beneficial.11 The American Society of Anesthesiology states that “the literature supports the use of antidepressants for reducing chronic pain without notable adverse effects.”12 The Arthritis Foundation lists amitriptyline, duloxetine, fluoxetine, and paroxetine as treatment options for pain and for helping sleep in fibromyalgia.13
1. Salerno SM, Browning R, Jackson JL. The effect of antidepressant treatment on chronic back pain: a meta-analysis. Arch Intern Med 2002;162:19-24.
2. Staiger TO, Gaster B, Sullivan MD, Deyo RA. Systematic review of antidepressants in the treatment of chronic low back pain. Spine 2003;28:2540-2545.
3. Newton WP, Collins L, Fotinos C. Clinical inquiries. What is the best treatment for diabetic neuropathy? J Fam Pract 2004;53:403-408.
4. Holten KB. Irritable bowel syndrome: minimize testing, let symptoms guide treatment. J Fam Pract 2003;52:942-950.
5. Guzman J, Esmail R, Karjalainen K, Malmivaara A, Irvin E, Bombardier C. Multidisciplinary bio-psycho-social rehabilitation for chronic low-back pain. Cochrane Database Syst Rev 2002;(1):CD000963.
6. Ostelo RW, van Tulder MW, Vlaeyen JW, Linton SJ, Morley SJ, Assendelft WJ. Behavioural treatment for chronic low back pain. Cochrane Database Syst Rev 2005;(1):CD002014.
7. Morley S, Eccleston C, Williams A. Systematic review and meta-analysis of randomized controlled trials of cognitive behaviour therapy and behaviour therapy for chronic pain in adults, excluding headache. Pain 1999;80:1-13.
8. Astin JA, Beckner W, Soeken K, Hochberg MC, Berman B. Psychological interventions for rheumatoid arthritis: a meta-analysis of randomized controlled trials. Arthritis Rheum 2002;47:291-302.
9. Devine EC. Meta-analysis of the effect of psychoeducational interventions on pain in adults with cancer. Oncol Nurs Forum 2003;30:75-89.
10. Raine R, Haines A, Sensky T, Hutchings A, Larkin K, Black N. Systematic review of mental health interventions for patients with common somatic symptoms: can research from secondary care be extrapolated to primary care? BMJ 2002;325:1082-1085.
11. The National Institutes of Health State-of-the-Science Conference on Symptom Management in Cancer: Pain Depression and Fatigue. Bethesda, Md: Oxford University Press, 2004.
12. Practice guidelines for chronic pain management. A report by the American Society of Anesthesiologists Task Force on Pain Management, Chronic Pain Section. Anesthesiology 1997;86:995-1004.
13. Fibromyalgia drugs. Arthritis Today’s Drug Guide 2005. Available at: www.arthritis.org/conditions/DrugGuide/about_fibromyalgia.asp. Accessed on February 9, 2006.
Tricyclic antidepressants and intensive multi-disciplinary programs are moderately effective for reducing chronic back pain; tricyclics are also effective for diabetic neuropathy and irritable bowel syndrome (strength of recommendation [SOR]: A, meta-analyses and multiple small randomized controlled trials).
Cognitive therapies are modestly effective for reducing pain in the following: chronic back pain, other chronic musculoskeletal disorders including rheumatoid arthritis (SOR: B, multiple meta-analyses with significant heterogeneity), and for chronic cancer pain (SOR: B, 1 meta-analysis of various quality studies).
Consider tricyclics for all chronic pain sufferers without a contraindication
Stan Sherman, MD
Oklahoma State University, Tulsa
Dealing with issues of chronic pain is frustrating for both clinicians and patients. With inability to relieve the patient’s pain, confounding factors of medication overuse, noncompliance, and secondary gain or malingering often cloud the clinical picture. Add to this the high rate of comorbid depression, and it makes sense to use behavioral services in treating patient’s pain.
But does it really help? The evidence indicates that behavioral treatment helps some, but it depends who is doing the treating, and the intensity of the therapy. By far the easiest evidence to put into practice is the use of tricyclic antidepressants, which should probably be prescribed to all chronic pain sufferers who do not have a medical contraindication, such as suicide risk or heart disease.
Evidence summary
Amitriptyline and other tricyclic and tetracyclic antidepressants moderately improve pain control for patients with chronic back pain.1,2 The pain reduction was independent of the presence of depression, although patients who were depressed had a significant improvement in mood. The outcome on chronic pain of antidepressants with serotonin and norepinephrine reuptake inhibitory activity is still being evaluated. It appears that those with only SSRI activity are not effective improving chronic pain.2
Tricyclics are effective for diabetic neuropathy (number needed to treat [NNT]=3.5 for 50% reduction of pain),3 and they are effective for reducing pain but not for global symptoms in irritable bowel syndrome.4 Amitriptyline reduces the pain of diabetic peripheral neuropathy in a dose related manner up to 150 mg/d, although much lower doses are often effective and cause fewer anticholinergic side-effects.
For chronic back pain, a Cochrane review including 1964 patients found strong evidence for pain reduction and modest evidence for functional improvement from intensive (>100 hours) multidisciplinary biopsychosocial rehabilitation. Less intense and less comprehensive psychophysical programs did not reduce pain or improve function.5 It was unclear if the intensive programs were generalizable. Another review found that cognitive and progressive relaxation therapy had a moderate effect on short-term pain control vs waiting-list controls for chronic back pain. However, only a third of the studies were of “high quality,” and the total number of patients in the relaxation analysis was 39.6
A systematic review of 25 studies (1672 patients) found significant effect sizes for cognitive therapies in reducing pain and other symptoms in chronic musculoskeletal pain, including rheumatoid arthritis, fibromyalgia, back, and other pain syndromes.7 However, many of the trials were small or taken from “samples of convenience” from rehabilitation and pain clinics, and most lacked documentation of randomization. For rheumatoid arthritis alone, a systematic review of 19 studies found cognitive therapies had a small but statistically significant effect on pain, functional disability, depression, coping, and self-efficacy for 1298 patients at initial follow-up. However, only “tender points” and coping remained improved at subsequent follow-ups averaging 8.5 months.8
In adults with cancer pain, a recent meta-analysis of 1723 patients showed modest but significant effects on pain from psycho-educational interventions in 25 studies.9 Although just 3 of the studies lasted 52 weeks or longer, effects were found from good-quality studies for “relaxation-promoting,” educational, and supportive counseling plus content therapies.
A significant confounder in many of these studies may be that some treatments seem more effective in secondary care than in primary care settings, as based on a systemic review of interventions for somatic symptoms in primary care.10
Recommendations from others
The NIH states that antidepressants are effective adjuvants in pain management, and that cognitive-behavioral treatments may be beneficial.11 The American Society of Anesthesiology states that “the literature supports the use of antidepressants for reducing chronic pain without notable adverse effects.”12 The Arthritis Foundation lists amitriptyline, duloxetine, fluoxetine, and paroxetine as treatment options for pain and for helping sleep in fibromyalgia.13
1. Salerno SM, Browning R, Jackson JL. The effect of antidepressant treatment on chronic back pain: a meta-analysis. Arch Intern Med 2002;162:19-24.
2. Staiger TO, Gaster B, Sullivan MD, Deyo RA. Systematic review of antidepressants in the treatment of chronic low back pain. Spine 2003;28:2540-2545.
3. Newton WP, Collins L, Fotinos C. Clinical inquiries. What is the best treatment for diabetic neuropathy? J Fam Pract 2004;53:403-408.
4. Holten KB. Irritable bowel syndrome: minimize testing, let symptoms guide treatment. J Fam Pract 2003;52:942-950.
5. Guzman J, Esmail R, Karjalainen K, Malmivaara A, Irvin E, Bombardier C. Multidisciplinary bio-psycho-social rehabilitation for chronic low-back pain. Cochrane Database Syst Rev 2002;(1):CD000963.
6. Ostelo RW, van Tulder MW, Vlaeyen JW, Linton SJ, Morley SJ, Assendelft WJ. Behavioural treatment for chronic low back pain. Cochrane Database Syst Rev 2005;(1):CD002014.
7. Morley S, Eccleston C, Williams A. Systematic review and meta-analysis of randomized controlled trials of cognitive behaviour therapy and behaviour therapy for chronic pain in adults, excluding headache. Pain 1999;80:1-13.
8. Astin JA, Beckner W, Soeken K, Hochberg MC, Berman B. Psychological interventions for rheumatoid arthritis: a meta-analysis of randomized controlled trials. Arthritis Rheum 2002;47:291-302.
9. Devine EC. Meta-analysis of the effect of psychoeducational interventions on pain in adults with cancer. Oncol Nurs Forum 2003;30:75-89.
10. Raine R, Haines A, Sensky T, Hutchings A, Larkin K, Black N. Systematic review of mental health interventions for patients with common somatic symptoms: can research from secondary care be extrapolated to primary care? BMJ 2002;325:1082-1085.
11. The National Institutes of Health State-of-the-Science Conference on Symptom Management in Cancer: Pain Depression and Fatigue. Bethesda, Md: Oxford University Press, 2004.
12. Practice guidelines for chronic pain management. A report by the American Society of Anesthesiologists Task Force on Pain Management, Chronic Pain Section. Anesthesiology 1997;86:995-1004.
13. Fibromyalgia drugs. Arthritis Today’s Drug Guide 2005. Available at: www.arthritis.org/conditions/DrugGuide/about_fibromyalgia.asp. Accessed on February 9, 2006.
Evidence-based answers from the Family Physicians Inquiries Network
What is the appropriate management for a patient with CIN1 on colposcopy?
Of the different strategies available for managing cervical intraepithelial neoplasia grade 1 (CIN1), testing for high-risk subtypes of the human papillomavirus (hr-HPV) DNA at 12 months has the highest sensitivity for predicting the development of CIN2 or CIN3 and leads to the lowest rate of referral to repeat colposcopy (TABLE 1). If the hr-HPV DNA test result is negative at 12 months, then the patient may return to routine cytology screening. If the hr-HPV DNA test result is positive, the patient should undergo repeat colposcopy.1,2
Base follow-up testing on patient preference, cost, and convenience
Patients with a colposcopic biopsy revealing mild dysplasia (HPV effect or CIN1) need follow-up due to the 12% risk of progression to CIN2 or CIN3 over 2 years.1 The decision to follow the patient with either a single HPV test at 12 months or cytologic testing at 6 and 12 months should be based on patient preference, cost, and convenience. One of the 2 follow-up strategies should be selected and a notification system implemented to ensure patients return at the appropriate follow-up interval.
Evidence summary
One study was found that attempted to determine the appropriate follow-up for women diagnosed with CIN1 on adequate colposcopic biopsy (FIGURE). This 2-year prospective study examined a subpopulation of 1539 women from the ASCUS/LSIL (atypical squamous cells of uncertain significance)/low-grade squamous intraepithelial lesion) Triage Study (ALTS) to determine the ideal follow-up strategy for women diagnosed with CIN1 or HPV effect on colposcopic biopsy-obtained histology. This study randomly assigned these women with CIN1 or HPV effect to either HPV testing or colposcopic examination at 6, 12, and 18 months. Every woman under-went an exit colposcopy at 24 months.
The study found that hr-HPV testing 12 months after the initial colposcopic exam had the highest sensitivity for detecting advanced disease (92.2%) and lowest referral rate to repeat colposcopy (55%). Follow-up of these patients with repeat cytology alone at 6 and 12 months had a lower sensitivity for detection of advanced disease (85%) and greater referral rate to repeat colposcopy (60%) when compared with HPV testing at 12 months alone. Three cytologic evaluations at 6, 12, and 18 months without HPV testing increased sensitivity (95%), although this increase was not statistically significant. A much higher percentage of patients were referred to colposcopy with this strategy. Combining both hr-HPV testing and cytology at 12 months did not significantly increase the identification of advanced disease and resulted in a higher re-referral rate to colposcopy.1-3
TABLE
Strategies for managing CIN1
| FOLLOW-UP/INTERVENTION AFTER DIAGNOSIS OF CIN1 AT COLPOSCOPY | SENSITIVITY FOR DETECTING CIN1 OR HIGHER | REFERRAL RATE FOR REPEAT COLPOSCOPY |
|---|---|---|
| hr-HPV test at 12 months | 92.2% | 55% |
| hr-HPV test at 6 months | 90.9% | 62.4% |
| Cytology at 6 and 12 months | 85% | 60% |
| Cytology at 6, 12, 18 months | 95% | Not available |
| hr-HPV test and cytology at 12 months | 94.8% | 64.1% |
| CIN1, cervical intraepithelial neoplasia grade 1; hr-HPV, high-risk subtypes of human papillomavirus. | ||
| Source: Guido et al, Am J Obstet Gynecol 20031; Guido et al, J Lower Genital Tract Dis 2002.2 | ||
Recommendations from others
American Society for Colposcopy and Cervical Pathology consensus guidelines for the management of women with CIN were published in 2003. Their recommendation now states that follow-up after adequate colposcopy with a biopsy revealing CIN1 or HPV effect may include either repeat cervical cytology tests at 6 and 12 months or HPV testing at 12 months. After a negative test for high-risk HPV types or 2 consecutive negative cervical cytology tests, the patient may return to annual cytologic screening. If the HPV test is positive for high-risk viral types or the cytology is reported as atypical squamous cells (ASC) or higher, the patient should undergo repeat colposcopy.4
1. Guido R, Schiffman M, Solomon D, Burke L. ASCUS LSIL Triage Study (ALTS) Group. Postcolposcopy management strategies for women referred with low-grade squamous intraepithelial lesions or human papillomavirus DNA-positive atypical squamous cells of undetermined significance: a two year prospective study. Am J Obstet Gynecol 2003;188:1401-1405.
2. Guido R, Solomon D, Schiffman M, Burke L. Comparison of management strategies for women diagnosed as CIN 1 or less postcolposcopic evaluation: data from the ASCUS and LSIL triage study (ALTS), a multicenter randomized trial. J Lower Genital Tract Dis 2002;6:176.-
3. Schiffman M, Adrianza ME. ALTS Group. ASCUS-LSIL Triage Study. Design, methods, and characteristics of trial participants. Acta Cytol 2000;44:726-742
4. Wright TC, Jr, Cox JT, Massad LS, Carlson J, Twiggs LB, Wilkinson EJ. American Society for Colposcopy and Cervical Pathology 2001 consensus guidelines for the management of women with cervical intraepithelial neoplasia. Am J Obstet Gynecol 2003;189:295-304.
Of the different strategies available for managing cervical intraepithelial neoplasia grade 1 (CIN1), testing for high-risk subtypes of the human papillomavirus (hr-HPV) DNA at 12 months has the highest sensitivity for predicting the development of CIN2 or CIN3 and leads to the lowest rate of referral to repeat colposcopy (TABLE 1). If the hr-HPV DNA test result is negative at 12 months, then the patient may return to routine cytology screening. If the hr-HPV DNA test result is positive, the patient should undergo repeat colposcopy.1,2
Base follow-up testing on patient preference, cost, and convenience
Patients with a colposcopic biopsy revealing mild dysplasia (HPV effect or CIN1) need follow-up due to the 12% risk of progression to CIN2 or CIN3 over 2 years.1 The decision to follow the patient with either a single HPV test at 12 months or cytologic testing at 6 and 12 months should be based on patient preference, cost, and convenience. One of the 2 follow-up strategies should be selected and a notification system implemented to ensure patients return at the appropriate follow-up interval.
Evidence summary
One study was found that attempted to determine the appropriate follow-up for women diagnosed with CIN1 on adequate colposcopic biopsy (FIGURE). This 2-year prospective study examined a subpopulation of 1539 women from the ASCUS/LSIL (atypical squamous cells of uncertain significance)/low-grade squamous intraepithelial lesion) Triage Study (ALTS) to determine the ideal follow-up strategy for women diagnosed with CIN1 or HPV effect on colposcopic biopsy-obtained histology. This study randomly assigned these women with CIN1 or HPV effect to either HPV testing or colposcopic examination at 6, 12, and 18 months. Every woman under-went an exit colposcopy at 24 months.
The study found that hr-HPV testing 12 months after the initial colposcopic exam had the highest sensitivity for detecting advanced disease (92.2%) and lowest referral rate to repeat colposcopy (55%). Follow-up of these patients with repeat cytology alone at 6 and 12 months had a lower sensitivity for detection of advanced disease (85%) and greater referral rate to repeat colposcopy (60%) when compared with HPV testing at 12 months alone. Three cytologic evaluations at 6, 12, and 18 months without HPV testing increased sensitivity (95%), although this increase was not statistically significant. A much higher percentage of patients were referred to colposcopy with this strategy. Combining both hr-HPV testing and cytology at 12 months did not significantly increase the identification of advanced disease and resulted in a higher re-referral rate to colposcopy.1-3
TABLE
Strategies for managing CIN1
| FOLLOW-UP/INTERVENTION AFTER DIAGNOSIS OF CIN1 AT COLPOSCOPY | SENSITIVITY FOR DETECTING CIN1 OR HIGHER | REFERRAL RATE FOR REPEAT COLPOSCOPY |
|---|---|---|
| hr-HPV test at 12 months | 92.2% | 55% |
| hr-HPV test at 6 months | 90.9% | 62.4% |
| Cytology at 6 and 12 months | 85% | 60% |
| Cytology at 6, 12, 18 months | 95% | Not available |
| hr-HPV test and cytology at 12 months | 94.8% | 64.1% |
| CIN1, cervical intraepithelial neoplasia grade 1; hr-HPV, high-risk subtypes of human papillomavirus. | ||
| Source: Guido et al, Am J Obstet Gynecol 20031; Guido et al, J Lower Genital Tract Dis 2002.2 | ||
Recommendations from others
American Society for Colposcopy and Cervical Pathology consensus guidelines for the management of women with CIN were published in 2003. Their recommendation now states that follow-up after adequate colposcopy with a biopsy revealing CIN1 or HPV effect may include either repeat cervical cytology tests at 6 and 12 months or HPV testing at 12 months. After a negative test for high-risk HPV types or 2 consecutive negative cervical cytology tests, the patient may return to annual cytologic screening. If the HPV test is positive for high-risk viral types or the cytology is reported as atypical squamous cells (ASC) or higher, the patient should undergo repeat colposcopy.4
1. Guido R, Schiffman M, Solomon D, Burke L. ASCUS LSIL Triage Study (ALTS) Group. Postcolposcopy management strategies for women referred with low-grade squamous intraepithelial lesions or human papillomavirus DNA-positive atypical squamous cells of undetermined significance: a two year prospective study. Am J Obstet Gynecol 2003;188:1401-1405.
2. Guido R, Solomon D, Schiffman M, Burke L. Comparison of management strategies for women diagnosed as CIN 1 or less postcolposcopic evaluation: data from the ASCUS and LSIL triage study (ALTS), a multicenter randomized trial. J Lower Genital Tract Dis 2002;6:176.-
3. Schiffman M, Adrianza ME. ALTS Group. ASCUS-LSIL Triage Study. Design, methods, and characteristics of trial participants. Acta Cytol 2000;44:726-742
4. Wright TC, Jr, Cox JT, Massad LS, Carlson J, Twiggs LB, Wilkinson EJ. American Society for Colposcopy and Cervical Pathology 2001 consensus guidelines for the management of women with cervical intraepithelial neoplasia. Am J Obstet Gynecol 2003;189:295-304.
Evidence-based answers from the Family Physicians Inquiries Network