User login
Statistical Modeling and Aggregate-Weighted Scoring Systems in Prediction of Mortality and ICU Transfer: A Systematic Review
Ensuring the delivery of safe and cost-effective care is the core mission of hospitals,1 but nearly 90% of unplanned patient transfers to critical care may be the result of a new or worsening condition.2 The cost of treatment of sepsis, respiratory failure, and arrest, which are among the deadliest conditions for hospitalized patients,3,4 are estimated to be $30.7 billion annually (8.1% of national hospital costs).5 As many as 44% of adverse events may be avoidable,6 and concerns about patient safety have motivated hospitals and health systems to find solutions to identify and treat deteriorating patients expeditiously. Evidence suggests that many hospitalized patients presenting with rapid decline showed warning signs 24-48 hours before the event.7 Therefore, ample time may be available for early identification and intervention in many patients.
As early as 1997, hospitals have used early warning systems (EWSs) to identify at-risk patients and proactively inform clinicians.8 EWSs can predict a proportion of patients who are at risk for clinical deterioration (this benefit is measured with sensitivity) with the tradeoff that some alerts are false (as measured with positive predictive value [PPV] or its inverse, workup-to-detection ratio [WDR]9-11). Historically, EWS tools were paper-based instruments designed for fast manual calculation by hospital staff. Many aggregate-weighted EWS instruments continue to be used for research and practice, including the Modified Early Warning Systems (MEWS)12 and National Early Warning System (NEWS).13,14 Aggregate-weighted EWSs lack predictive precision because they use simple addition of a few clinical parameter scores, including vital signs and level of consciousness.15 Recently, a new category has emerged, which use multivariable regression or machine learning; we refer to this category as “EWSs using statistical modeling”. This type of EWS uses more computationally intensive risk stratification methods to predict risk16 by adjusting for a larger set of clinical covariates, thereby reducing the degree of unexplained variance. Although these EWSs are thought to be more precise and to generate fewer false positive alarms compared with others,14,17-19 no review to date has systematically synthesized and compared their performance against aggregate-weighted EWSs.
Purpose
The purpose of this systematic review was to evaluate the recent literature regarding prognostic test accuracy and clinical workloads generated by EWSs using statistical modeling versus aggregate-weighted systems.
METHODS
Search Strategy
Adhering to PRISMA protocol guidelines for systematic reviews, we searched the peer-reviewed literature in PubMed and CINAHL Plus, as well as conference proceedings and online repositories of patient safety organizations published between January 1, 2012 and September 15, 2018. We selected this timeframe because EWSs using statistical modeling are relatively new approaches compared with the body of evidence concerning aggregate-weighted EWSs. An expert PhD researcher confirmed the search results in a blinded independent query.
Inclusion and Exclusion Criteria
We included peer-reviewed articles reporting the area under the receiver operator curve (AUC),20 or the equivalent c-statistic, of models predicting clinical deterioration (measured as the composite of transfer to intensive care unit (ICU) and/or mortality) among adult patients in general hospital wards. We excluded studies if they did not compare an EWS using statistical modeling with an aggregate-weighted EWS, did not report AUC, or only reported on an aggregate-weighted EWS. Excluded settings were pediatrics, obstetrics, emergency departments, ICUs, transitional care units, and oncology. We also excluded studies with samples limited to physiological monitoring, sepsis, or postsurgical subpopulations.
Data Abstraction
Following the TRIPOD guidelines for the reporting of predictive models,21 and the PRISMA and Cochrane Collaboration guidelines for systematic reviews,22-24 we extracted study characteristics (Table 1), sample demographics (Appendix Table 4), model characteristics and performance (Appendix Table 5), and level of scientific evidence and risk of bias (Appendix Table 6). To address the potential for overfitting, we selected model performance results of the validation dataset rather than the derivation dataset, if reported. If studies reported multiple models in either EWS category, we selected the best-performing model for comparison.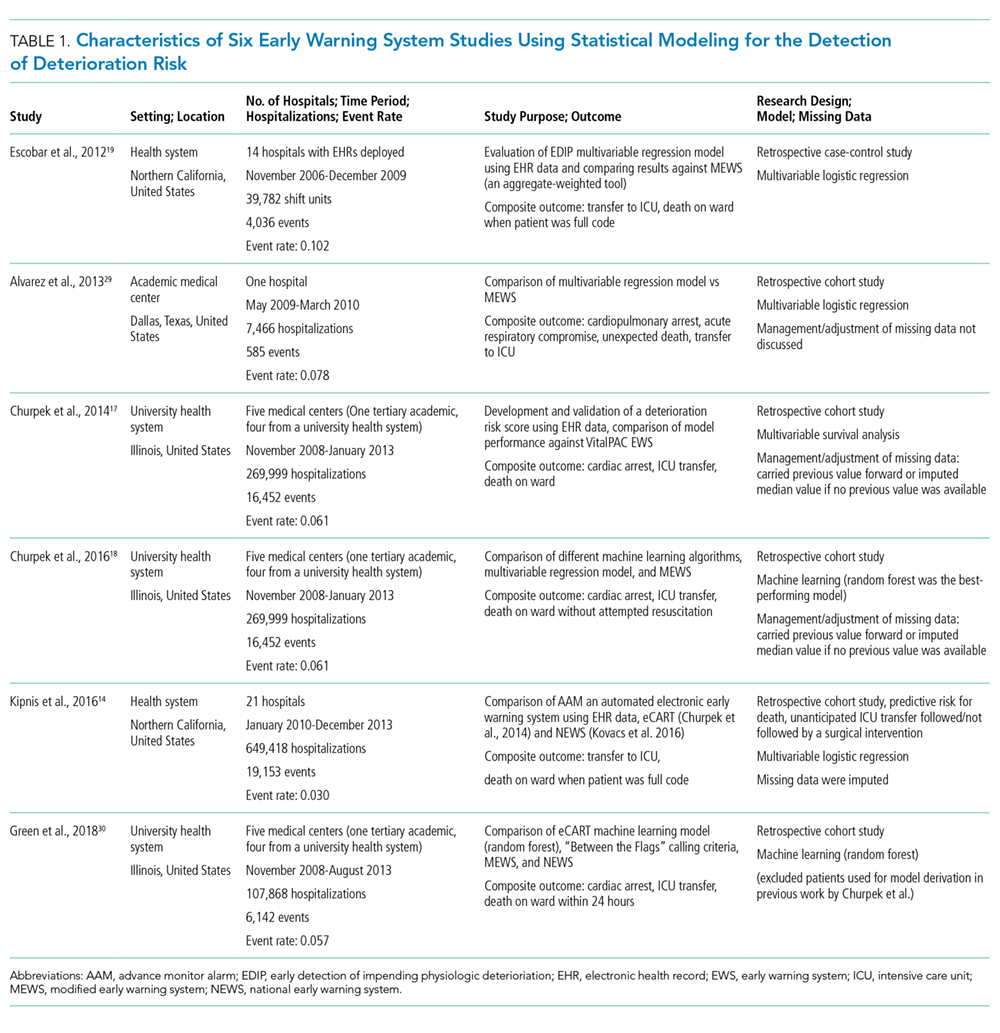
Measures of Model Performance
Because predictive models can achieve good case identification at the expense of high clinical workloads, an assessment of model performance would be incomplete without measures of clinical utility. For clinicians, this aspect can be measured as the model’s PPV (the percentage of true positive alerts among all alerts), or more intelligibly, as the WDR, which equals 1/PPV. WDR indicates the number of patients requiring evaluation to identify and treat one true positive case.9-11 It is known that differences in event rates (prevalence or pretest probability) influence a model’s PPV25 and its reciprocal WDR. However, for systematic comparison, PPV and WDR can be standardized using a fixed representative event rate across studies.24,26 We abstracted the reported PPV and WDR, and computed standardized PPV and WDR for an event rate of 4%.
Other measures included the area under the receiver operator curve (AUC),20 sensitivity, and specificity. AUC plots a model’s false positive rate (x-axis) against its true positive rate (y-axis), with an ideal scenario of very high y-values and very low x-values.27 Sensitivity (the model’s ability to detect a true positive case among all cases) and specificity (the model’s ability to detect a true noncase among all noncases28) are influenced by chosen alert thresholds. It is incorrect to assume that a given model produces only one sensitivity/specificity result; for systematic comparison, we therefore selected results in the 50% sensitivity range, and separately, in the 92% specificity range for EWSs using statistical modeling. Then, we simulated a fixed sensitivity of 0.51 and assumed specificity of 0.87 in aggregate-weighted EWSs.
RESULTS
Search Results
The PubMed search for “early warning score OR early warning system AND deterioration OR predict transfer ICU” returned 285 peer-reviewed articles. A search on CINAHL Plus using the same filters and query terms returned 219 articles with no additional matches (Figure 1). Of the 285 articles, we excluded 269 during the abstract screen and 10 additional articles during full-text review (Figure 1). A final review of the reference lists of the six selected studies did not yield additional articles.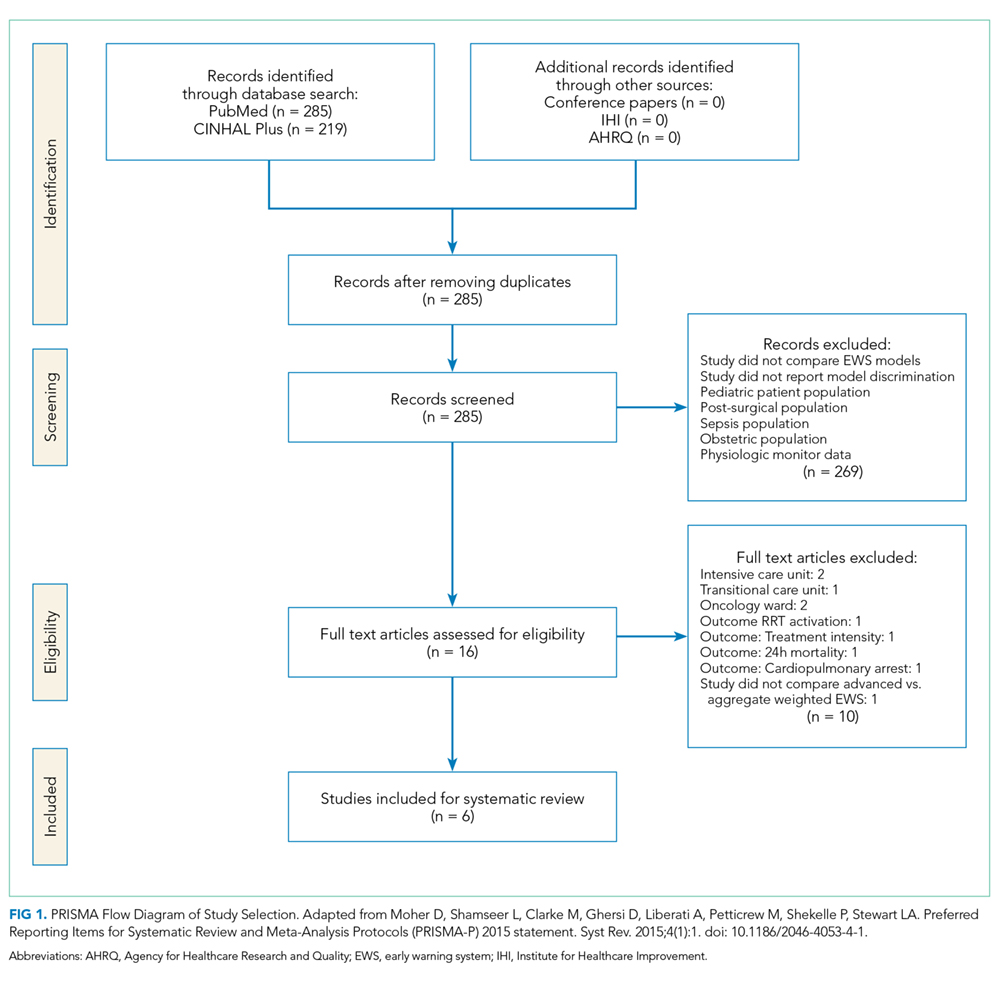
Study Characteristics
There were several similarities across the selected studies (Table 1). All occurred in the United States; all compared their model’s performance against at least one aggregate-weighted EWS model;14,17-19,29 and all used retrospective cohort designs. Of the six studies, one took place in a single hospital;29 three pooled data from five hospitals;17,18,30 and two occurred in a large integrated healthcare delivery system using data from 14 and, subsequently, 21 hospitals.14,19 The largest study14 included nearly 650,000 admissions, while the smallest study29 reported slightly less than 7,500 admissions. Of the six studies, four used multivariable regression,14,17,19,29 and two used machine learning techniques for outcome prediction.18,30
Outcome Variables
The primary outcome for inclusion in this review was clinical deterioration measured by the composite of transfer to ICU and some measure of mortality. Churpek et al.10,11 and Green et al.30 also included cardiac arrest, and Alvarez et al.22 included respiratory compromise in their outcome composite.
Researchers used varying definitions of mortality, including “death outside the ICU in a patient whose care directive was full code;”14,19 “death on the wards without attempted resuscitation;”17,18 “an in-hospital death in patients without a DNR order at admission that occurred on the medical ward or in ICU within 24 hours after transfer;”29 or “death within 24 hours.”30
Predictor Variables
We observed a broad assortment of predictor variables. All models included vital signs (heart rate, respiratory rate, blood pressure, and venous oxygen saturation); mental state; laboratory data; age; and sex. Additional variables included comorbidity, shock index,31 severity of illness score, length of stay, event time of day, season, admission category, and length of stay,14,19 among others.
Model Performance
Reported PPV ranged from 0.16 to 0.42 (mean = 0.27) in EWSs using statistical modeling and 0.15 to 0.28 (mean = 0.19) in aggregate-weighted EWS models. The weighted mean standardized PPV, adjusted for an event rate of 4% across studies (Table 2), was 0.21 in EWSs using statistical modeling versus 0.14 in aggregate-weighted EWS models (simulated at 0.51 sensitivity and 0.87 specificity).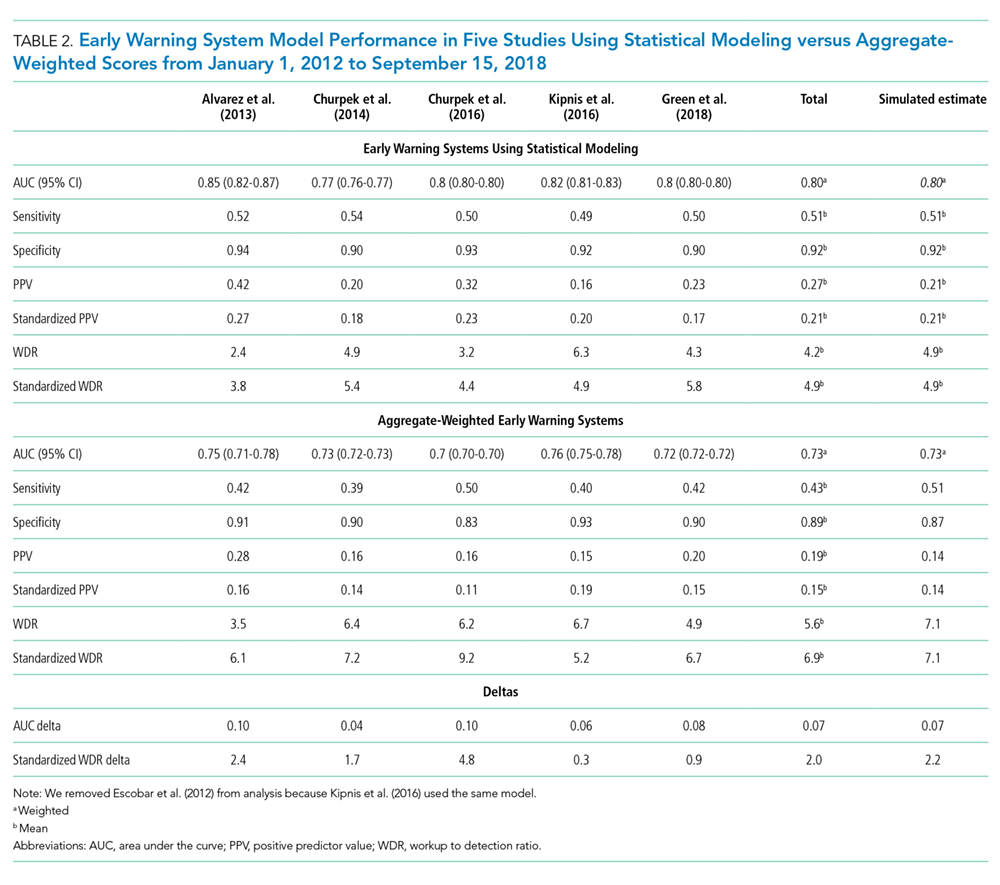
Only two studies14,19 reported the WDR metric (alerts generated to identify one true positive case) explicitly. Based on the above PPV results, EWSs using statistical modeling generated a standardized WDR of 4.9 in models using statistical modeling versus 7.1 in aggregate-weighted models (Figure 2). The delta of 2.2 evaluations to find and treat one true positive case equals a 45% relative increase in RRT evaluation workloads using aggregate-weighted EWSs.
AUC values ranged from 0.77 to 0.85 (weighted mean = 0.80) in EWSs using statistical modeling, indicating good model discrimination. AUCs of aggregate-weighted EWSs ranged from 0.70 to 0.76 (weighted mean = 0.73), indicating fair model discrimination (Figure 2). The overall AUC delta was 0.07. However, our estimates may possibly be favoring EWSs that use statistical modeling by virtue of their derivation in an original research population compared with aggregate-weighted EWSs that were derived externally. For example, sensitivity analysis of eCART,18 an EWS using machine learning, showed an AUC drop of 1% in a large external patient population,14 while NEWS AUCs13 dropped between 11% and 15% in two large external populations (Appendix Table 7).14,30 For hospitals adopting an externally developed EWS using statistical modeling, these results suggest that an AUC delta of approximately 5% can be expected and 7% for an internally developed EWS.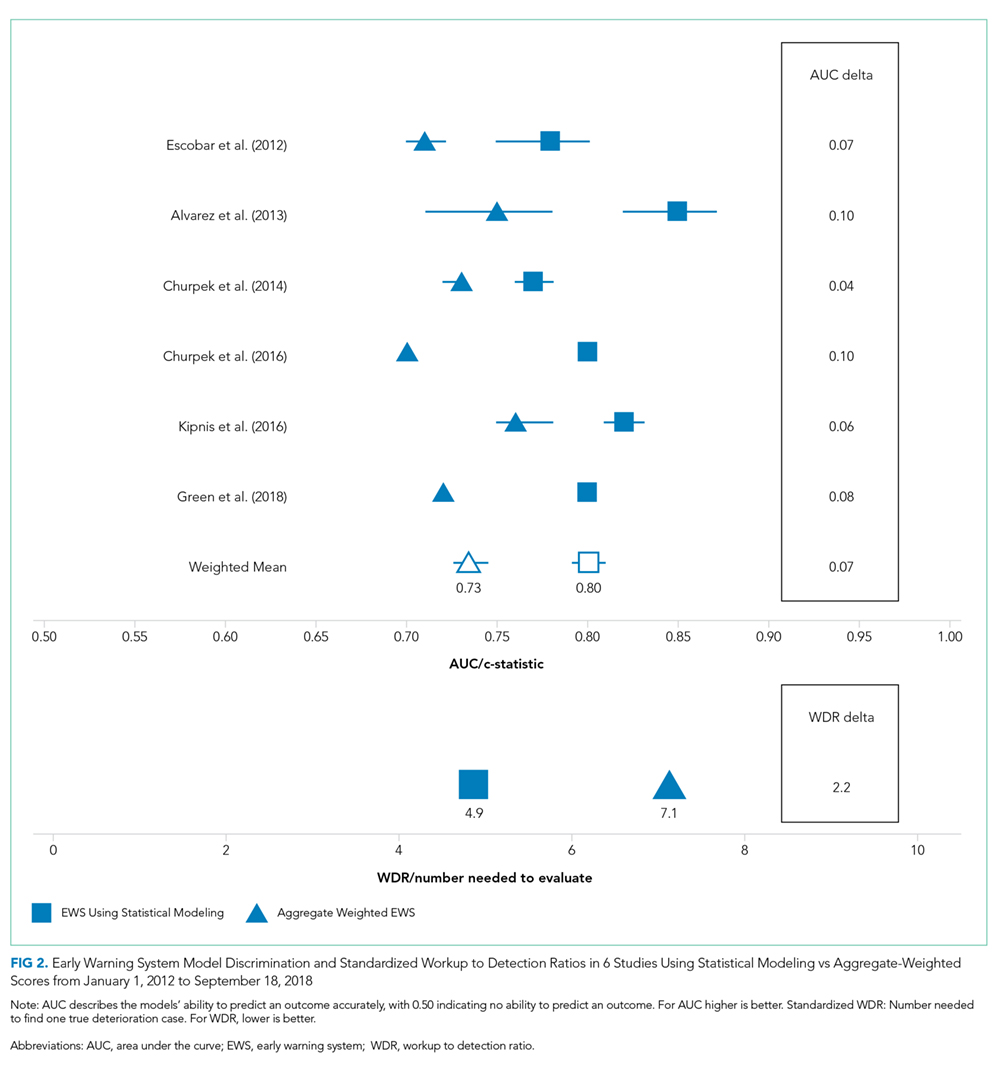
The models’ sensitivity ranged from 0.49 to 0.54 (mean = 0.51) for EWSs using statistical modeling and 0.39 to 0.50 (mean = 0.43). These results were based on chosen alert volume cutoffs. Specificity ranged from 0.90 to 0.94 (mean = 0.92) in EWSs using statistical modeling compared with 0.83 to 0.93 (mean = 0.89) in aggregate-weighted EWS models. At the 0.51 sensitivity level (mean sensitivity of reported EWSs using statistical modeling), aggregate-weighted EWSs would have an estimated specificity of approximately 0.87. Conversely, to reach a specificity of 0.92 (mean specificity of reported EWSs using statistical modeling, aggregate-weighted EWSs would have a sensitivity of approximately 0.42 compared with 0.50 in EWSs using statistical modeling (based on three studies reporting both sensitivity and specificity or an AUC graph).
Risk of Bias Assessment
We scored the studies by adapting the Cochrane Collaboration tool for assessing risk of bias 32 (Appendix Table 5). Of the six studies, five received total scores between 1.0 and 2.0 (indicating relatively low bias risk), and one study had a score of 3.5 (indicating higher bias risk). Low bias studies14,17-19,30 used large samples across multiple hospitals, discussed the choice of predictor variables and outcomes more precisely, and reported their measurement approaches and analytic methods in more detail, including imputation of missing data and model calibration.
DISCUSSION
In this systematic review, we assessed the predictive ability of EWSs using statistical modeling versus aggregate-weighted EWS models to detect clinical deterioration risk in hospitalized adults in general wards. From 2007 to 2018, at least five systematic reviews examined aggregate-weighted EWSs in adult inpatient settings.33-37 No systematic review, however, has synthesized the evidence of EWSs using statistical modeling.
The recent evidence is limited to six studies, of which five had favorable risk of bias scores. All studies included in this review demonstrated superior model performance of the EWSs using statistical modeling compared with an aggregate-weighted EWS, and at least five of the six studies employed rigor in design, measurement, and analytic method. The AUC absolute difference between EWSs using statistical modeling and aggregate-weighted EWSs was 7% overall, moving model performance from fair to good (Table 2; Figure 2). Although this increase in discriminative power may appear modest, it translates into avoiding a 45% increase in WDR workload generated by an aggregate-weighted EWS, approximately two patient evaluations for each true positive case.
Results of our review suggest that EWSs using statistical modeling predict clinical deterioration risk with better precision. This is an important finding for the following reasons: (1) Better risk prediction can support the activation of rescue; (2) Given federal mandates to curb spending, the elimination of some resource-intensive false positive evaluations supports high-value care;38 and (3) The Quadruple Aim39 accounts for clinician wellbeing. EWSs using statistical modeling may offer benefits in terms of clinician satisfaction with the human–system interface because better discrimination reduces the daily evaluation workload/cognitive burden and because the reduction of false positive alerts may reduce alert fatigue.40,41
Still, an important issue with risk detection is that it is unknown which percentage of patients are uniquely identified by an EWS and not already under evaluation by the clinical team. For example, a recent study by Bedoya et al.42 found that using NEWS did not improve clinical outcomes and nurses frequently disregarded the alert. Another study43 found that the combined clinical judgment of physicians and nurses had an AUC of 0.90 in predicting mortality. These results suggest that at certain times, an EWS alert may not add new useful information for clinicians even when it correctly identifies deterioration risk. It remains difficult to define exactly how many patients an EWS would have to uniquely identify to have clinical utility.
Even EWSs that use statistical modeling cannot detect all true deterioration cases perfectly, and they may at times trigger an alert only when the clinical team is already aware of a patient’s clinical decline. Consequently, EWSs using statistical modeling can at best augment and support—but not replace—RRT rounding, physician workup, and vigilant frontline staff. However, clinicians, too, are not perfect, and the failure-to-rescue literature suggests that certain human factors are antecedents to patient crises (eg, stress and distraction,44-46 judging by precedent/experience,44,47 and innate limitations of human cognition47). Because neither clinicians nor EWSs can predict deterioration perfectly, the best possible rescue response combines clinical vigilance, RRT rounding, and EWSs using statistical modeling as complementary solutions.
Our findings suggest that predictive models cannot be judged purely on AUC (in fact, it would be ill-advised) but also by their clinical utility (expressed in WDR and PPV): How many patients does a clinician need to evaluate?9-11 Precision is not meaningful if it comes at the expense of unmanageable evaluation workloads, and our findings suggest that clinicians should evaluate models based on their clinical utility. Hospitals considering adoption of an EWS using statistical modeling should consider that externally developed EWSs appear to experience a performance drop when applied to a new patient population; a slightly higher WDR and slightly lower AUC can be expected. EWSs using statistical modeling appear to perform best when tailored to the targeted patient population (or are derived in-house). Model depreciation over time will likely require recalibration. In addition, adoption of a machine learning algorithm may mean that original model results are obscured by the black box output of the algorithm.48-50
Findings from this systematic review are subject to several limitations. First, we applied strict inclusion criteria, which led us to exclude studies that offered findings in specialty units and specific patient subpopulations, among others. In the interest of systematic comparison, our findings are limited to general wards. We also restricted our search to recent studies that reported on models predicting clinical deterioration, which we defined as the composite of ICU transfer and/or death. Clinically, deteriorating patients in general wards either die or are transferred to ICU. This criterion resulted in exclusion of the Rothman Index,51 which predicts “death within 24 hours” but not ICU transfer. The AUC in this study was higher than those selected in this review (0.93 compared to 0.82 for MEWS; AUC delta: 0.09). The higher AUC may be a function of the outcome definition (30-day mortality would be more challenging to predict). Therefore, hospitals or health systems interested in purchasing an EWS using statistical modeling should carefully consider the outcome selection and definition.
Second, as is true for systematic reviews in general,52 the degree of clinical and methodological heterogeneity across the selected studies may limit our findings. Studies occurred in various settings (university hospital, teaching hospitals, and community hospitals), which may serve diverging patient populations. We observed that studies in university-based settings had a higher event rate ranging from 5.6% to 7.8%, which may result in higher PPV results in these settings. However, this increase would apply to both EWS types equally. To arrive at a “true” reflection of model performance, the simulations for PPV and WDR have used a more conservative event rate of 4%. We observed heterogenous mortality definitions, which did not always account for the reality that a patient’s death may be an appropriate outcome (ie, it was concordant with treatment wishes in the context of severe illness or an end-of-life trajectory). Studies also used different sampling procedures; some allowed multiple observations although most did not. The variation in sampling may change PPV and limit our systematic comparison. However, regardless of methodological differences, our review suggests that EWSs using statistical modeling perform better than aggregate-weighted EWSs in each of the selected studies.
Third, systematic reviews may be subject to the issue of publication bias because they can only compare published results and could possibly omit an unknown number of unpublished studies. However, the selected studies uniformly demonstrated similar model improvements, which are plausibly related to the larger number of covariates, statistical methods, and shrinkage of random error.
Finally, this review was limited to the comparison of observational studies, which aimed to answer how the two EWS classes compared. These studies did not address whether an alert had an impact on clinical care and patient outcomes. Results from at least one randomized nonblinded controlled trial suggest that alert-driven RRT activation may reduce the length of stay by 24 hours and use of oximetry, but has no impact on mortality, ICU transfer, and ICU length of stay.53
CONCLUSION
Our findings point to three areas of need for the field of predictive EWS research: (1) a standardized set of clinical deterioration outcome measures, (2) a standardized set of measures capturing clinical evaluation workload and alert frequency, and (3) cost estimates of clinical workloads with and without deployment of an EWS using statistical modeling. Given the present divergence of outcome definitions, EWS research may benefit from a common “clinical deterioration” outcome standard, including transfer to ICU, inpatient/30-day/90-day mortality, and death with DNR, comfort care, or hospice. The field is lacking a standardized clinical workload measure and an understanding of the net percentage of patients uniquely identified by an EWS.
By using predictive analytics, health systems may be better able to achieve the goals of high-value care and patient safety and support the Quadruple Aim. Still, gaps in knowledge exist regarding the measurement of the clinical processes triggered by EWSs, evaluation workloads, alert fatigue, clinician burnout associated with the human-alert interface, and costs versus benefits. Future research should evaluate the degree to which EWSs can identify risk among patients who are not already under evaluation by the clinical team, assess the balanced treatment effects of RRT interventions between decedents and survivors, and investigate clinical process times relative to the time of an EWS alert using statistical modeling.
Acknowledgments
The authors would like to thank Ms. Jill Pope at the Kaiser Permanente Center for Health Research in Portland, OR for her assistance with manuscript preparation. Daniel Linnen would like to thank Dr. Linda Franck, PhD, RN, FAAN, Professor at the University of California, San Francisco, School of Nursing for reviewing the manuscript.
Disclosures
The authors declare no conflicts of interest.
Funding
The Maribelle & Stephen Leavitt Scholarship, the Jonas Nurse Scholars Scholarship at the University of California, San Francisco, and the Nurse Scholars Academy Predoctoral Research Fellowship at Kaiser Permanente Northern California supported this study during Daniel Linnen’s doctoral training at the University of California, San Francisco. Dr. Vincent Liu was funded by National Institute of General Medical Sciences Grant K23GM112018.
1. Institute of Medicine (US) Committee on Quality of Health Care in America; Kohn LT, Corrigan JM, Donaldson MS, editors. To Err is Human: Building a Safer Health System. Washington (DC): National Academies Press (US); 2000. PubMed
2. Bapoje SR, Gaudiani JL, Narayanan V, Albert RK. Unplanned transfers to a medical intensive care unit: causes and relationship to preventable errors in care. J Hosp Med. 2011;6(2):68-72. doi: 10.1002/jhm.812. PubMed
3. Liu V, Escobar GJ, Greene JD, et al. Hospital deaths in patients with sepsis from 2 independent cohorts. JAMA. 2014;312(1):90-92. doi: 10.1001/jama.2014.5804. PubMed
4. Winters BD, Pham JC, Hunt EA, et al. Rapid response systems: a systematic review. Crit Care Med. 2007;35(5):1238-1243. doi: 10.1097/01.CCM.0000262388.85669.68. PubMed
5. Torio C. Andrews RM (AHRQ). National inpatient hospital costs: the most expensive conditions by payer, 2011. HCUP Statistical Brief# 160. August 2013. Agency for Healthcare Research and Quality, Rockville, MD. Agency for Healthcare Research and Quality. 2015. http://www.ncbi.nlm.nih.gov/books/NBK169005/. Accessed July 10, 2018. PubMed
6. Levinson DR, General I. Adverse events in hospitals: national incidence among Medicare beneficiaries. Department of Health and Human Services Office of the Inspector General. 2010.
7. McGaughey J, Alderdice F, Fowler R, et al. Outreach and Early Warning Systems (EWS) for the prevention of intensive care admission and death of critically ill adult patients on general hospital wards. Cochrane Database Syst Rev. 2007;3(3):CD005529:Cd005529. doi: 10.1002/14651858.CD005529.pub2. PubMed
8. Morgan R, Williams F, Wright M. An early warning score for the early detection of patients with impending illness. Clin Intensive Care. 1997;8:100.
9. Escobar GJ, Dellinger RP. Early detection, prevention, and mitigation of critical illness outside intensive care settings. J Hosp Med. 2016;11(1):S5-S10. doi: 10.1002/jhm.2653. PubMed
10. Escobar GJ, Ragins A, Scheirer P, et al. Nonelective rehospitalizations and postdischarge mortality: predictive models suitable for use in real time. Med Care. 2015;53(11):916-923. doi: 10.1097/MLR.0000000000000435. PubMed
11. Liu VX. Toward the “plateau of productivity”: enhancing the value of machine learning in critical care. Crit Care Med. 2018;46(7):1196-1197. doi: 10.1097/CCM.0000000000003170. PubMed
12. Subbe CP, Kruger M, Rutherford P, Gemmel L. Validation of a modified Early Warning Score in medical admissions. QJM. 2001;94(10):521-526. doi: 10.1093/qjmed/94.10.521. PubMed
13. Smith GB, Prytherch DR, Meredith P, Schmidt PE, Featherstone PI. The ability of the National Early Warning Score (NEWS) to discriminate patients at risk of early cardiac arrest, unanticipated intensive care unit admission, and death. Resuscitation. 2013;84(4):465-470. doi: 10.1016/j.resuscitation.2012.12.016. PubMed
14. Kipnis P, Turk BJ, Wulf DA, et al. Development and validation of an electronic medical record-based alert score for detection of inpatient deterioration outside the ICU. J Biomed Inform. 2016;64:10-19. doi: 10.1016/j.jbi.2016.09.013. PubMed
15. Romero-Brufau S, Huddleston JM, Naessens JM, et al. Widely used track and trigger scores: are they ready for automation in practice? Resuscitation. 2014;85(4):549-552. doi: 10.1016/j.resuscitation.2013.12.017. PubMed
16. Bates DW, Saria S, Ohno-Machado L, Shah A, Escobar G. Big data in health care: using analytics to identify and manage high-risk and high-cost patients. Health Aff (Millwood). 2014;33(7):1123-1131. doi: 10.1377/hlthaff.2014.0041. PubMed
17. Churpek MM, Yuen TC, Park SY, Gibbons R, Edelson DP. Using electronic health record data to develop and validate a prediction model for adverse outcomes in the wards. Crit Care Med. 2014;42(4):841-848. doi: 10.1097/CCM.0000000000000038. PubMed
18. Churpek MM, Yuen TC, Winslow C, et al. Multicenter comparison of machine learning methods and conventional regression for predicting clinical deterioration on the wards. Crit Care Med. 2016;44(2):368-374. doi: 10.1097/CCM.0000000000001571. PubMed
19. Escobar GJ, LaGuardia JC, Turk BJ, et al. Early detection of impending physiologic deterioration among patients who are not in intensive care: development of predictive models using data from an automated electronic medical record. J Hosp Med. 2012;7(5):388-395. doi: 10.1002/jhm.1929. PubMed
20. Zweig MH, Campbell G. Receiver-operating characteristic (ROC) plots: a fundamental evaluation tool in clinical medicine. Clin Chem. 1993;39(4):561-577. PubMed
21. Collins GS, Reitsma JB, Altman DG, Moons KG. Transparent reporting of a multivariable prediction model for individual prognosis or diagnosis (TRIPOD): the TRIPOD statement. BMC Med. 2015;13(1):1. doi: 10.1186/s12916-014-0241-z. PubMed
22. Moher D, Liberati A, Tetzlaff J, Altman DG, PRISMA Group. Preferred reporting items for systematic reviews and meta-analyses: the Prisma statement. PLOS Med. 2009;6(7):e1000097. doi: 10.1371/journal.pmed.1000097. PubMed
23. Higgins JP, Green S. Cochrane handbook for systematic reviews of interventions version 5.1. 0. The Cochrane Collaboration. 2011;5.
24. Bossuyt P, Davenport C, Deeks J, et al. Interpreting results and drawing conclusions. In: Higgins PTJ, Green S, eds. Cochrane Handbook for Systematic Reviews of Diagnostic Test Accuracy Version 0.9. The Cochrane Collaboration; 2013. Chapter 11
25. Altman DG, Bland JM. Statistics Notes: Diagnostic tests 2: predictive values. BMJ. 1994;309(6947):102. doi: 10.1136/bmj.309.6947.102. PubMed
26. Heston TF. Standardizing predictive values in diagnostic imaging research. J Magn Reson Imaging. 2011;33(2):505; author reply 506-507. doi: 10.1002/jmri.22466. PubMed
27. Hanley JA, McNeil BJ. The meaning and use of the area under a receiver operating characteristic (ROC) curve. Radiology. 1982;143(1):29-36. doi: 10.1148/radiology.143.1.7063747. PubMed
28. Bewick V, Cheek L, Ball J. Statistics review 13: receiver operating characteristic curves. Crit Care. 2004;8(6):508-512. doi: 10.1186/cc3000. PubMed
29. Alvarez CA, Clark CA, Zhang S, et al. Predicting out of intensive care unit cardiopulmonary arrest or death using electronic medical record data. BMC Med Inform Decis Mak. 2013;13:28. doi: 10.1186/1472-6947-13-28. PubMed
30. Green M, Lander H, Snyder A, et al. Comparison of the between the FLAGS calling criteria to the MEWS, NEWS and the electronic Cardiac Arrest Risk Triage (eCART) score for the identification of deteriorating ward patients. Resuscitation. 2018;123:86-91. doi: 10.1016/j.resuscitation.2017.10.028. PubMed
31. Berger T, Green J, Horeczko T, et al. Shock index and early recognition of sepsis in the emergency department: pilot study. West J Emerg Med. 2013;14(2):168-174. doi: 10.5811/westjem.2012.8.11546. PubMed
32. Higgins JPT, Altman DG, Gøtzsche PC, et al. The Cochrane Collaboration’s tool for assessing risk of bias in randomised trials. BMJ. 2011;343:d5928-d5928. doi: 10.1136/bmj.d5928.
33. Johnstone CC, Rattray J, Myers L. Physiological risk factors, early warning scoring systems and organizational changes. Nurs Crit Care. 2007;12(5):219-224. doi: 10.1111/j.1478-5153.2007.00238.x. PubMed
34. McNeill G, Bryden D. Do either early warning systems or emergency response teams improve hospital patient survival? A systematic review. Resuscitation. 2013;84(12):1652-1667. doi: 10.1016/j.resuscitation.2013.08.006. PubMed
35. Smith M, Chiovaro J, O’Neil M, et al. Early Warning System Scores: A Systematic Review. In: Washington (DC): Department of Veterans Affairs (US); 2014 Jan: https://www.ncbi.nlm.nih.gov/books/NBK259031/. Accessed January 23, 2017. PubMed
36. Smith ME, Chiovaro JC, O’Neil M, et al. Early warning system scores for clinical deterioration in hospitalized patients: a systematic review. Ann Am Thorac Soc. 2014;11(9):1454-1465. doi: 10.1513/AnnalsATS.201403-102OC. PubMed
37. Subbe CP, Williams E, Fligelstone L, Gemmell L. Does earlier detection of critically ill patients on surgical wards lead to better outcomes? Ann R Coll Surg Engl. 2005;87(4):226-232. doi: 10.1308/003588405X50921. PubMed
38. Berwick DM, Hackbarth AD. Eliminating waste in us health care. JAMA. 2012;307(14):1513-1516. doi: 10.1001/jama.2012.362. PubMed
39. Sikka R, Morath JM, Leape L. The Quadruple Aim: care, health, cost and meaning in work.. BMJ Quality & Safety. 2015;24(10):608-610. doi: 10.1136/bmjqs-2015-004160. PubMed
40. Guardia-Labar LM, Scruth EA, Edworthy J, Foss-Durant AM, Burgoon DH. Alarm fatigue: the human-system interface. Clin Nurse Spec. 2014;28(3):135-137. doi: 10.1097/NUR.0000000000000039. PubMed
41. Ruskin KJ, Hueske-Kraus D. Alarm fatigue: impacts on patient safety. Curr Opin Anaesthesiol. 2015;28(6):685-690. doi: 10.1097/ACO.0000000000000260. PubMed
42. Bedoya AD, Clement ME, Phelan M, et al. Minimal impact of implemented early warning score and best practice alert for patient deterioration. Crit Care Med. 2019;47(1):49-55. doi: 10.1097/CCM.0000000000003439. PubMed
43. Brabrand M, Hallas J, Knudsen T. Nurses and physicians in a medical admission unit can accurately predict mortality of acutely admitted patients: A prospective cohort study. PLoS One. 2014;9(7):e101739. doi: 10.1371/journal.pone.0101739. PubMed
44. Acquaviva K, Haskell H, Johnson J. Human cognition and the dynamics of failure to rescue: the Lewis Blackman case. J Prof Nurs. 2013;29(2):95-101. doi: 10.1016/j.profnurs.2012.12.009. PubMed
45. Jones A, Johnstone MJ. Inattentional blindness and failures to rescue the deteriorating patient in critical care, emergency and perioperative settings: four case scenarios. Aust Crit Care. 2017;30(4):219-223. doi: 10.1016/j.aucc.2016.09.005. PubMed
46. Reason J. Understanding adverse events: human factors. Qual Health Care. 1995;4(2):80-89. doi: 10.1136/qshc.4.2.80. PubMed
47. Bate L, Hutchinson A, Underhill J, Maskrey N. How clinical decisions are made. Br J Clin Pharmacol. 2012;74(4):614-620. doi: 10.1111/j.1365-2125.2012.04366.x. PubMed
48. Cabitza F, Rasoini R, Gensini GF. Unintended consequences of machine learning in medicine. JAMA. 2017;318(6):517-518. doi: 10.1001/jama.2017.7797. PubMed
49. Stead WW. Clinical implications and challenges of artificial intelligence and deep learning. JAMA. 2018;320(11):1107-1108. doi: 10.1001/jama.2018.11029. PubMed
50. Wong TY, Bressler NM. Artificial intelligence with deep learning technology looks into diabetic retinopathy screening. JAMA. 2016;316(22):2366-2367. doi: 10.1001/jama.2016.17563. PubMed
51. Finlay GD, Rothman MJ, Smith RA. Measuring the modified early warning score and the Rothman index: advantages of utilizing the electronic medical record in an early warning system. J Hosp Med. 2014;9(2):116-119. doi: 10.1002/jhm.2132. PubMed
52. Gagnier JJ, Moher D, Boon H, Beyene J, Bombardier C. Investigating clinical heterogeneity in systematic reviews: a methodologic review of guidance in the literature. BMC Med Res Methodol. 2012;12:111-111. doi: 10.1186/1471-2288-12-111. PubMed
53. Kollef MH, Chen Y, Heard K, et al. A randomized trial of real-time automated clinical deterioration alerts sent to a rapid response team. J Hosp Med. 2014;9(7):424-429. doi: 10.1002/jhm.2193. PubMed
Ensuring the delivery of safe and cost-effective care is the core mission of hospitals,1 but nearly 90% of unplanned patient transfers to critical care may be the result of a new or worsening condition.2 The cost of treatment of sepsis, respiratory failure, and arrest, which are among the deadliest conditions for hospitalized patients,3,4 are estimated to be $30.7 billion annually (8.1% of national hospital costs).5 As many as 44% of adverse events may be avoidable,6 and concerns about patient safety have motivated hospitals and health systems to find solutions to identify and treat deteriorating patients expeditiously. Evidence suggests that many hospitalized patients presenting with rapid decline showed warning signs 24-48 hours before the event.7 Therefore, ample time may be available for early identification and intervention in many patients.
As early as 1997, hospitals have used early warning systems (EWSs) to identify at-risk patients and proactively inform clinicians.8 EWSs can predict a proportion of patients who are at risk for clinical deterioration (this benefit is measured with sensitivity) with the tradeoff that some alerts are false (as measured with positive predictive value [PPV] or its inverse, workup-to-detection ratio [WDR]9-11). Historically, EWS tools were paper-based instruments designed for fast manual calculation by hospital staff. Many aggregate-weighted EWS instruments continue to be used for research and practice, including the Modified Early Warning Systems (MEWS)12 and National Early Warning System (NEWS).13,14 Aggregate-weighted EWSs lack predictive precision because they use simple addition of a few clinical parameter scores, including vital signs and level of consciousness.15 Recently, a new category has emerged, which use multivariable regression or machine learning; we refer to this category as “EWSs using statistical modeling”. This type of EWS uses more computationally intensive risk stratification methods to predict risk16 by adjusting for a larger set of clinical covariates, thereby reducing the degree of unexplained variance. Although these EWSs are thought to be more precise and to generate fewer false positive alarms compared with others,14,17-19 no review to date has systematically synthesized and compared their performance against aggregate-weighted EWSs.
Purpose
The purpose of this systematic review was to evaluate the recent literature regarding prognostic test accuracy and clinical workloads generated by EWSs using statistical modeling versus aggregate-weighted systems.
METHODS
Search Strategy
Adhering to PRISMA protocol guidelines for systematic reviews, we searched the peer-reviewed literature in PubMed and CINAHL Plus, as well as conference proceedings and online repositories of patient safety organizations published between January 1, 2012 and September 15, 2018. We selected this timeframe because EWSs using statistical modeling are relatively new approaches compared with the body of evidence concerning aggregate-weighted EWSs. An expert PhD researcher confirmed the search results in a blinded independent query.
Inclusion and Exclusion Criteria
We included peer-reviewed articles reporting the area under the receiver operator curve (AUC),20 or the equivalent c-statistic, of models predicting clinical deterioration (measured as the composite of transfer to intensive care unit (ICU) and/or mortality) among adult patients in general hospital wards. We excluded studies if they did not compare an EWS using statistical modeling with an aggregate-weighted EWS, did not report AUC, or only reported on an aggregate-weighted EWS. Excluded settings were pediatrics, obstetrics, emergency departments, ICUs, transitional care units, and oncology. We also excluded studies with samples limited to physiological monitoring, sepsis, or postsurgical subpopulations.
Data Abstraction
Following the TRIPOD guidelines for the reporting of predictive models,21 and the PRISMA and Cochrane Collaboration guidelines for systematic reviews,22-24 we extracted study characteristics (Table 1), sample demographics (Appendix Table 4), model characteristics and performance (Appendix Table 5), and level of scientific evidence and risk of bias (Appendix Table 6). To address the potential for overfitting, we selected model performance results of the validation dataset rather than the derivation dataset, if reported. If studies reported multiple models in either EWS category, we selected the best-performing model for comparison.
Measures of Model Performance
Because predictive models can achieve good case identification at the expense of high clinical workloads, an assessment of model performance would be incomplete without measures of clinical utility. For clinicians, this aspect can be measured as the model’s PPV (the percentage of true positive alerts among all alerts), or more intelligibly, as the WDR, which equals 1/PPV. WDR indicates the number of patients requiring evaluation to identify and treat one true positive case.9-11 It is known that differences in event rates (prevalence or pretest probability) influence a model’s PPV25 and its reciprocal WDR. However, for systematic comparison, PPV and WDR can be standardized using a fixed representative event rate across studies.24,26 We abstracted the reported PPV and WDR, and computed standardized PPV and WDR for an event rate of 4%.
Other measures included the area under the receiver operator curve (AUC),20 sensitivity, and specificity. AUC plots a model’s false positive rate (x-axis) against its true positive rate (y-axis), with an ideal scenario of very high y-values and very low x-values.27 Sensitivity (the model’s ability to detect a true positive case among all cases) and specificity (the model’s ability to detect a true noncase among all noncases28) are influenced by chosen alert thresholds. It is incorrect to assume that a given model produces only one sensitivity/specificity result; for systematic comparison, we therefore selected results in the 50% sensitivity range, and separately, in the 92% specificity range for EWSs using statistical modeling. Then, we simulated a fixed sensitivity of 0.51 and assumed specificity of 0.87 in aggregate-weighted EWSs.
RESULTS
Search Results
The PubMed search for “early warning score OR early warning system AND deterioration OR predict transfer ICU” returned 285 peer-reviewed articles. A search on CINAHL Plus using the same filters and query terms returned 219 articles with no additional matches (Figure 1). Of the 285 articles, we excluded 269 during the abstract screen and 10 additional articles during full-text review (Figure 1). A final review of the reference lists of the six selected studies did not yield additional articles.
Study Characteristics
There were several similarities across the selected studies (Table 1). All occurred in the United States; all compared their model’s performance against at least one aggregate-weighted EWS model;14,17-19,29 and all used retrospective cohort designs. Of the six studies, one took place in a single hospital;29 three pooled data from five hospitals;17,18,30 and two occurred in a large integrated healthcare delivery system using data from 14 and, subsequently, 21 hospitals.14,19 The largest study14 included nearly 650,000 admissions, while the smallest study29 reported slightly less than 7,500 admissions. Of the six studies, four used multivariable regression,14,17,19,29 and two used machine learning techniques for outcome prediction.18,30
Outcome Variables
The primary outcome for inclusion in this review was clinical deterioration measured by the composite of transfer to ICU and some measure of mortality. Churpek et al.10,11 and Green et al.30 also included cardiac arrest, and Alvarez et al.22 included respiratory compromise in their outcome composite.
Researchers used varying definitions of mortality, including “death outside the ICU in a patient whose care directive was full code;”14,19 “death on the wards without attempted resuscitation;”17,18 “an in-hospital death in patients without a DNR order at admission that occurred on the medical ward or in ICU within 24 hours after transfer;”29 or “death within 24 hours.”30
Predictor Variables
We observed a broad assortment of predictor variables. All models included vital signs (heart rate, respiratory rate, blood pressure, and venous oxygen saturation); mental state; laboratory data; age; and sex. Additional variables included comorbidity, shock index,31 severity of illness score, length of stay, event time of day, season, admission category, and length of stay,14,19 among others.
Model Performance
Reported PPV ranged from 0.16 to 0.42 (mean = 0.27) in EWSs using statistical modeling and 0.15 to 0.28 (mean = 0.19) in aggregate-weighted EWS models. The weighted mean standardized PPV, adjusted for an event rate of 4% across studies (Table 2), was 0.21 in EWSs using statistical modeling versus 0.14 in aggregate-weighted EWS models (simulated at 0.51 sensitivity and 0.87 specificity).
Only two studies14,19 reported the WDR metric (alerts generated to identify one true positive case) explicitly. Based on the above PPV results, EWSs using statistical modeling generated a standardized WDR of 4.9 in models using statistical modeling versus 7.1 in aggregate-weighted models (Figure 2). The delta of 2.2 evaluations to find and treat one true positive case equals a 45% relative increase in RRT evaluation workloads using aggregate-weighted EWSs.
AUC values ranged from 0.77 to 0.85 (weighted mean = 0.80) in EWSs using statistical modeling, indicating good model discrimination. AUCs of aggregate-weighted EWSs ranged from 0.70 to 0.76 (weighted mean = 0.73), indicating fair model discrimination (Figure 2). The overall AUC delta was 0.07. However, our estimates may possibly be favoring EWSs that use statistical modeling by virtue of their derivation in an original research population compared with aggregate-weighted EWSs that were derived externally. For example, sensitivity analysis of eCART,18 an EWS using machine learning, showed an AUC drop of 1% in a large external patient population,14 while NEWS AUCs13 dropped between 11% and 15% in two large external populations (Appendix Table 7).14,30 For hospitals adopting an externally developed EWS using statistical modeling, these results suggest that an AUC delta of approximately 5% can be expected and 7% for an internally developed EWS.
The models’ sensitivity ranged from 0.49 to 0.54 (mean = 0.51) for EWSs using statistical modeling and 0.39 to 0.50 (mean = 0.43). These results were based on chosen alert volume cutoffs. Specificity ranged from 0.90 to 0.94 (mean = 0.92) in EWSs using statistical modeling compared with 0.83 to 0.93 (mean = 0.89) in aggregate-weighted EWS models. At the 0.51 sensitivity level (mean sensitivity of reported EWSs using statistical modeling), aggregate-weighted EWSs would have an estimated specificity of approximately 0.87. Conversely, to reach a specificity of 0.92 (mean specificity of reported EWSs using statistical modeling, aggregate-weighted EWSs would have a sensitivity of approximately 0.42 compared with 0.50 in EWSs using statistical modeling (based on three studies reporting both sensitivity and specificity or an AUC graph).
Risk of Bias Assessment
We scored the studies by adapting the Cochrane Collaboration tool for assessing risk of bias 32 (Appendix Table 5). Of the six studies, five received total scores between 1.0 and 2.0 (indicating relatively low bias risk), and one study had a score of 3.5 (indicating higher bias risk). Low bias studies14,17-19,30 used large samples across multiple hospitals, discussed the choice of predictor variables and outcomes more precisely, and reported their measurement approaches and analytic methods in more detail, including imputation of missing data and model calibration.
DISCUSSION
In this systematic review, we assessed the predictive ability of EWSs using statistical modeling versus aggregate-weighted EWS models to detect clinical deterioration risk in hospitalized adults in general wards. From 2007 to 2018, at least five systematic reviews examined aggregate-weighted EWSs in adult inpatient settings.33-37 No systematic review, however, has synthesized the evidence of EWSs using statistical modeling.
The recent evidence is limited to six studies, of which five had favorable risk of bias scores. All studies included in this review demonstrated superior model performance of the EWSs using statistical modeling compared with an aggregate-weighted EWS, and at least five of the six studies employed rigor in design, measurement, and analytic method. The AUC absolute difference between EWSs using statistical modeling and aggregate-weighted EWSs was 7% overall, moving model performance from fair to good (Table 2; Figure 2). Although this increase in discriminative power may appear modest, it translates into avoiding a 45% increase in WDR workload generated by an aggregate-weighted EWS, approximately two patient evaluations for each true positive case.
Results of our review suggest that EWSs using statistical modeling predict clinical deterioration risk with better precision. This is an important finding for the following reasons: (1) Better risk prediction can support the activation of rescue; (2) Given federal mandates to curb spending, the elimination of some resource-intensive false positive evaluations supports high-value care;38 and (3) The Quadruple Aim39 accounts for clinician wellbeing. EWSs using statistical modeling may offer benefits in terms of clinician satisfaction with the human–system interface because better discrimination reduces the daily evaluation workload/cognitive burden and because the reduction of false positive alerts may reduce alert fatigue.40,41
Still, an important issue with risk detection is that it is unknown which percentage of patients are uniquely identified by an EWS and not already under evaluation by the clinical team. For example, a recent study by Bedoya et al.42 found that using NEWS did not improve clinical outcomes and nurses frequently disregarded the alert. Another study43 found that the combined clinical judgment of physicians and nurses had an AUC of 0.90 in predicting mortality. These results suggest that at certain times, an EWS alert may not add new useful information for clinicians even when it correctly identifies deterioration risk. It remains difficult to define exactly how many patients an EWS would have to uniquely identify to have clinical utility.
Even EWSs that use statistical modeling cannot detect all true deterioration cases perfectly, and they may at times trigger an alert only when the clinical team is already aware of a patient’s clinical decline. Consequently, EWSs using statistical modeling can at best augment and support—but not replace—RRT rounding, physician workup, and vigilant frontline staff. However, clinicians, too, are not perfect, and the failure-to-rescue literature suggests that certain human factors are antecedents to patient crises (eg, stress and distraction,44-46 judging by precedent/experience,44,47 and innate limitations of human cognition47). Because neither clinicians nor EWSs can predict deterioration perfectly, the best possible rescue response combines clinical vigilance, RRT rounding, and EWSs using statistical modeling as complementary solutions.
Our findings suggest that predictive models cannot be judged purely on AUC (in fact, it would be ill-advised) but also by their clinical utility (expressed in WDR and PPV): How many patients does a clinician need to evaluate?9-11 Precision is not meaningful if it comes at the expense of unmanageable evaluation workloads, and our findings suggest that clinicians should evaluate models based on their clinical utility. Hospitals considering adoption of an EWS using statistical modeling should consider that externally developed EWSs appear to experience a performance drop when applied to a new patient population; a slightly higher WDR and slightly lower AUC can be expected. EWSs using statistical modeling appear to perform best when tailored to the targeted patient population (or are derived in-house). Model depreciation over time will likely require recalibration. In addition, adoption of a machine learning algorithm may mean that original model results are obscured by the black box output of the algorithm.48-50
Findings from this systematic review are subject to several limitations. First, we applied strict inclusion criteria, which led us to exclude studies that offered findings in specialty units and specific patient subpopulations, among others. In the interest of systematic comparison, our findings are limited to general wards. We also restricted our search to recent studies that reported on models predicting clinical deterioration, which we defined as the composite of ICU transfer and/or death. Clinically, deteriorating patients in general wards either die or are transferred to ICU. This criterion resulted in exclusion of the Rothman Index,51 which predicts “death within 24 hours” but not ICU transfer. The AUC in this study was higher than those selected in this review (0.93 compared to 0.82 for MEWS; AUC delta: 0.09). The higher AUC may be a function of the outcome definition (30-day mortality would be more challenging to predict). Therefore, hospitals or health systems interested in purchasing an EWS using statistical modeling should carefully consider the outcome selection and definition.
Second, as is true for systematic reviews in general,52 the degree of clinical and methodological heterogeneity across the selected studies may limit our findings. Studies occurred in various settings (university hospital, teaching hospitals, and community hospitals), which may serve diverging patient populations. We observed that studies in university-based settings had a higher event rate ranging from 5.6% to 7.8%, which may result in higher PPV results in these settings. However, this increase would apply to both EWS types equally. To arrive at a “true” reflection of model performance, the simulations for PPV and WDR have used a more conservative event rate of 4%. We observed heterogenous mortality definitions, which did not always account for the reality that a patient’s death may be an appropriate outcome (ie, it was concordant with treatment wishes in the context of severe illness or an end-of-life trajectory). Studies also used different sampling procedures; some allowed multiple observations although most did not. The variation in sampling may change PPV and limit our systematic comparison. However, regardless of methodological differences, our review suggests that EWSs using statistical modeling perform better than aggregate-weighted EWSs in each of the selected studies.
Third, systematic reviews may be subject to the issue of publication bias because they can only compare published results and could possibly omit an unknown number of unpublished studies. However, the selected studies uniformly demonstrated similar model improvements, which are plausibly related to the larger number of covariates, statistical methods, and shrinkage of random error.
Finally, this review was limited to the comparison of observational studies, which aimed to answer how the two EWS classes compared. These studies did not address whether an alert had an impact on clinical care and patient outcomes. Results from at least one randomized nonblinded controlled trial suggest that alert-driven RRT activation may reduce the length of stay by 24 hours and use of oximetry, but has no impact on mortality, ICU transfer, and ICU length of stay.53
CONCLUSION
Our findings point to three areas of need for the field of predictive EWS research: (1) a standardized set of clinical deterioration outcome measures, (2) a standardized set of measures capturing clinical evaluation workload and alert frequency, and (3) cost estimates of clinical workloads with and without deployment of an EWS using statistical modeling. Given the present divergence of outcome definitions, EWS research may benefit from a common “clinical deterioration” outcome standard, including transfer to ICU, inpatient/30-day/90-day mortality, and death with DNR, comfort care, or hospice. The field is lacking a standardized clinical workload measure and an understanding of the net percentage of patients uniquely identified by an EWS.
By using predictive analytics, health systems may be better able to achieve the goals of high-value care and patient safety and support the Quadruple Aim. Still, gaps in knowledge exist regarding the measurement of the clinical processes triggered by EWSs, evaluation workloads, alert fatigue, clinician burnout associated with the human-alert interface, and costs versus benefits. Future research should evaluate the degree to which EWSs can identify risk among patients who are not already under evaluation by the clinical team, assess the balanced treatment effects of RRT interventions between decedents and survivors, and investigate clinical process times relative to the time of an EWS alert using statistical modeling.
Acknowledgments
The authors would like to thank Ms. Jill Pope at the Kaiser Permanente Center for Health Research in Portland, OR for her assistance with manuscript preparation. Daniel Linnen would like to thank Dr. Linda Franck, PhD, RN, FAAN, Professor at the University of California, San Francisco, School of Nursing for reviewing the manuscript.
Disclosures
The authors declare no conflicts of interest.
Funding
The Maribelle & Stephen Leavitt Scholarship, the Jonas Nurse Scholars Scholarship at the University of California, San Francisco, and the Nurse Scholars Academy Predoctoral Research Fellowship at Kaiser Permanente Northern California supported this study during Daniel Linnen’s doctoral training at the University of California, San Francisco. Dr. Vincent Liu was funded by National Institute of General Medical Sciences Grant K23GM112018.
1. Institute of Medicine (US) Committee on Quality of Health Care in America; Kohn LT, Corrigan JM, Donaldson MS, editors. To Err is Human: Building a Safer Health System. Washington (DC): National Academies Press (US); 2000. PubMed
2. Bapoje SR, Gaudiani JL, Narayanan V, Albert RK. Unplanned transfers to a medical intensive care unit: causes and relationship to preventable errors in care. J Hosp Med. 2011;6(2):68-72. doi: 10.1002/jhm.812. PubMed
3. Liu V, Escobar GJ, Greene JD, et al. Hospital deaths in patients with sepsis from 2 independent cohorts. JAMA. 2014;312(1):90-92. doi: 10.1001/jama.2014.5804. PubMed
4. Winters BD, Pham JC, Hunt EA, et al. Rapid response systems: a systematic review. Crit Care Med. 2007;35(5):1238-1243. doi: 10.1097/01.CCM.0000262388.85669.68. PubMed
5. Torio C. Andrews RM (AHRQ). National inpatient hospital costs: the most expensive conditions by payer, 2011. HCUP Statistical Brief# 160. August 2013. Agency for Healthcare Research and Quality, Rockville, MD. Agency for Healthcare Research and Quality. 2015. http://www.ncbi.nlm.nih.gov/books/NBK169005/. Accessed July 10, 2018. PubMed
6. Levinson DR, General I. Adverse events in hospitals: national incidence among Medicare beneficiaries. Department of Health and Human Services Office of the Inspector General. 2010.
7. McGaughey J, Alderdice F, Fowler R, et al. Outreach and Early Warning Systems (EWS) for the prevention of intensive care admission and death of critically ill adult patients on general hospital wards. Cochrane Database Syst Rev. 2007;3(3):CD005529:Cd005529. doi: 10.1002/14651858.CD005529.pub2. PubMed
8. Morgan R, Williams F, Wright M. An early warning score for the early detection of patients with impending illness. Clin Intensive Care. 1997;8:100.
9. Escobar GJ, Dellinger RP. Early detection, prevention, and mitigation of critical illness outside intensive care settings. J Hosp Med. 2016;11(1):S5-S10. doi: 10.1002/jhm.2653. PubMed
10. Escobar GJ, Ragins A, Scheirer P, et al. Nonelective rehospitalizations and postdischarge mortality: predictive models suitable for use in real time. Med Care. 2015;53(11):916-923. doi: 10.1097/MLR.0000000000000435. PubMed
11. Liu VX. Toward the “plateau of productivity”: enhancing the value of machine learning in critical care. Crit Care Med. 2018;46(7):1196-1197. doi: 10.1097/CCM.0000000000003170. PubMed
12. Subbe CP, Kruger M, Rutherford P, Gemmel L. Validation of a modified Early Warning Score in medical admissions. QJM. 2001;94(10):521-526. doi: 10.1093/qjmed/94.10.521. PubMed
13. Smith GB, Prytherch DR, Meredith P, Schmidt PE, Featherstone PI. The ability of the National Early Warning Score (NEWS) to discriminate patients at risk of early cardiac arrest, unanticipated intensive care unit admission, and death. Resuscitation. 2013;84(4):465-470. doi: 10.1016/j.resuscitation.2012.12.016. PubMed
14. Kipnis P, Turk BJ, Wulf DA, et al. Development and validation of an electronic medical record-based alert score for detection of inpatient deterioration outside the ICU. J Biomed Inform. 2016;64:10-19. doi: 10.1016/j.jbi.2016.09.013. PubMed
15. Romero-Brufau S, Huddleston JM, Naessens JM, et al. Widely used track and trigger scores: are they ready for automation in practice? Resuscitation. 2014;85(4):549-552. doi: 10.1016/j.resuscitation.2013.12.017. PubMed
16. Bates DW, Saria S, Ohno-Machado L, Shah A, Escobar G. Big data in health care: using analytics to identify and manage high-risk and high-cost patients. Health Aff (Millwood). 2014;33(7):1123-1131. doi: 10.1377/hlthaff.2014.0041. PubMed
17. Churpek MM, Yuen TC, Park SY, Gibbons R, Edelson DP. Using electronic health record data to develop and validate a prediction model for adverse outcomes in the wards. Crit Care Med. 2014;42(4):841-848. doi: 10.1097/CCM.0000000000000038. PubMed
18. Churpek MM, Yuen TC, Winslow C, et al. Multicenter comparison of machine learning methods and conventional regression for predicting clinical deterioration on the wards. Crit Care Med. 2016;44(2):368-374. doi: 10.1097/CCM.0000000000001571. PubMed
19. Escobar GJ, LaGuardia JC, Turk BJ, et al. Early detection of impending physiologic deterioration among patients who are not in intensive care: development of predictive models using data from an automated electronic medical record. J Hosp Med. 2012;7(5):388-395. doi: 10.1002/jhm.1929. PubMed
20. Zweig MH, Campbell G. Receiver-operating characteristic (ROC) plots: a fundamental evaluation tool in clinical medicine. Clin Chem. 1993;39(4):561-577. PubMed
21. Collins GS, Reitsma JB, Altman DG, Moons KG. Transparent reporting of a multivariable prediction model for individual prognosis or diagnosis (TRIPOD): the TRIPOD statement. BMC Med. 2015;13(1):1. doi: 10.1186/s12916-014-0241-z. PubMed
22. Moher D, Liberati A, Tetzlaff J, Altman DG, PRISMA Group. Preferred reporting items for systematic reviews and meta-analyses: the Prisma statement. PLOS Med. 2009;6(7):e1000097. doi: 10.1371/journal.pmed.1000097. PubMed
23. Higgins JP, Green S. Cochrane handbook for systematic reviews of interventions version 5.1. 0. The Cochrane Collaboration. 2011;5.
24. Bossuyt P, Davenport C, Deeks J, et al. Interpreting results and drawing conclusions. In: Higgins PTJ, Green S, eds. Cochrane Handbook for Systematic Reviews of Diagnostic Test Accuracy Version 0.9. The Cochrane Collaboration; 2013. Chapter 11
25. Altman DG, Bland JM. Statistics Notes: Diagnostic tests 2: predictive values. BMJ. 1994;309(6947):102. doi: 10.1136/bmj.309.6947.102. PubMed
26. Heston TF. Standardizing predictive values in diagnostic imaging research. J Magn Reson Imaging. 2011;33(2):505; author reply 506-507. doi: 10.1002/jmri.22466. PubMed
27. Hanley JA, McNeil BJ. The meaning and use of the area under a receiver operating characteristic (ROC) curve. Radiology. 1982;143(1):29-36. doi: 10.1148/radiology.143.1.7063747. PubMed
28. Bewick V, Cheek L, Ball J. Statistics review 13: receiver operating characteristic curves. Crit Care. 2004;8(6):508-512. doi: 10.1186/cc3000. PubMed
29. Alvarez CA, Clark CA, Zhang S, et al. Predicting out of intensive care unit cardiopulmonary arrest or death using electronic medical record data. BMC Med Inform Decis Mak. 2013;13:28. doi: 10.1186/1472-6947-13-28. PubMed
30. Green M, Lander H, Snyder A, et al. Comparison of the between the FLAGS calling criteria to the MEWS, NEWS and the electronic Cardiac Arrest Risk Triage (eCART) score for the identification of deteriorating ward patients. Resuscitation. 2018;123:86-91. doi: 10.1016/j.resuscitation.2017.10.028. PubMed
31. Berger T, Green J, Horeczko T, et al. Shock index and early recognition of sepsis in the emergency department: pilot study. West J Emerg Med. 2013;14(2):168-174. doi: 10.5811/westjem.2012.8.11546. PubMed
32. Higgins JPT, Altman DG, Gøtzsche PC, et al. The Cochrane Collaboration’s tool for assessing risk of bias in randomised trials. BMJ. 2011;343:d5928-d5928. doi: 10.1136/bmj.d5928.
33. Johnstone CC, Rattray J, Myers L. Physiological risk factors, early warning scoring systems and organizational changes. Nurs Crit Care. 2007;12(5):219-224. doi: 10.1111/j.1478-5153.2007.00238.x. PubMed
34. McNeill G, Bryden D. Do either early warning systems or emergency response teams improve hospital patient survival? A systematic review. Resuscitation. 2013;84(12):1652-1667. doi: 10.1016/j.resuscitation.2013.08.006. PubMed
35. Smith M, Chiovaro J, O’Neil M, et al. Early Warning System Scores: A Systematic Review. In: Washington (DC): Department of Veterans Affairs (US); 2014 Jan: https://www.ncbi.nlm.nih.gov/books/NBK259031/. Accessed January 23, 2017. PubMed
36. Smith ME, Chiovaro JC, O’Neil M, et al. Early warning system scores for clinical deterioration in hospitalized patients: a systematic review. Ann Am Thorac Soc. 2014;11(9):1454-1465. doi: 10.1513/AnnalsATS.201403-102OC. PubMed
37. Subbe CP, Williams E, Fligelstone L, Gemmell L. Does earlier detection of critically ill patients on surgical wards lead to better outcomes? Ann R Coll Surg Engl. 2005;87(4):226-232. doi: 10.1308/003588405X50921. PubMed
38. Berwick DM, Hackbarth AD. Eliminating waste in us health care. JAMA. 2012;307(14):1513-1516. doi: 10.1001/jama.2012.362. PubMed
39. Sikka R, Morath JM, Leape L. The Quadruple Aim: care, health, cost and meaning in work.. BMJ Quality & Safety. 2015;24(10):608-610. doi: 10.1136/bmjqs-2015-004160. PubMed
40. Guardia-Labar LM, Scruth EA, Edworthy J, Foss-Durant AM, Burgoon DH. Alarm fatigue: the human-system interface. Clin Nurse Spec. 2014;28(3):135-137. doi: 10.1097/NUR.0000000000000039. PubMed
41. Ruskin KJ, Hueske-Kraus D. Alarm fatigue: impacts on patient safety. Curr Opin Anaesthesiol. 2015;28(6):685-690. doi: 10.1097/ACO.0000000000000260. PubMed
42. Bedoya AD, Clement ME, Phelan M, et al. Minimal impact of implemented early warning score and best practice alert for patient deterioration. Crit Care Med. 2019;47(1):49-55. doi: 10.1097/CCM.0000000000003439. PubMed
43. Brabrand M, Hallas J, Knudsen T. Nurses and physicians in a medical admission unit can accurately predict mortality of acutely admitted patients: A prospective cohort study. PLoS One. 2014;9(7):e101739. doi: 10.1371/journal.pone.0101739. PubMed
44. Acquaviva K, Haskell H, Johnson J. Human cognition and the dynamics of failure to rescue: the Lewis Blackman case. J Prof Nurs. 2013;29(2):95-101. doi: 10.1016/j.profnurs.2012.12.009. PubMed
45. Jones A, Johnstone MJ. Inattentional blindness and failures to rescue the deteriorating patient in critical care, emergency and perioperative settings: four case scenarios. Aust Crit Care. 2017;30(4):219-223. doi: 10.1016/j.aucc.2016.09.005. PubMed
46. Reason J. Understanding adverse events: human factors. Qual Health Care. 1995;4(2):80-89. doi: 10.1136/qshc.4.2.80. PubMed
47. Bate L, Hutchinson A, Underhill J, Maskrey N. How clinical decisions are made. Br J Clin Pharmacol. 2012;74(4):614-620. doi: 10.1111/j.1365-2125.2012.04366.x. PubMed
48. Cabitza F, Rasoini R, Gensini GF. Unintended consequences of machine learning in medicine. JAMA. 2017;318(6):517-518. doi: 10.1001/jama.2017.7797. PubMed
49. Stead WW. Clinical implications and challenges of artificial intelligence and deep learning. JAMA. 2018;320(11):1107-1108. doi: 10.1001/jama.2018.11029. PubMed
50. Wong TY, Bressler NM. Artificial intelligence with deep learning technology looks into diabetic retinopathy screening. JAMA. 2016;316(22):2366-2367. doi: 10.1001/jama.2016.17563. PubMed
51. Finlay GD, Rothman MJ, Smith RA. Measuring the modified early warning score and the Rothman index: advantages of utilizing the electronic medical record in an early warning system. J Hosp Med. 2014;9(2):116-119. doi: 10.1002/jhm.2132. PubMed
52. Gagnier JJ, Moher D, Boon H, Beyene J, Bombardier C. Investigating clinical heterogeneity in systematic reviews: a methodologic review of guidance in the literature. BMC Med Res Methodol. 2012;12:111-111. doi: 10.1186/1471-2288-12-111. PubMed
53. Kollef MH, Chen Y, Heard K, et al. A randomized trial of real-time automated clinical deterioration alerts sent to a rapid response team. J Hosp Med. 2014;9(7):424-429. doi: 10.1002/jhm.2193. PubMed
© 2019 Society of Hospital Medicine