To the Editor: We read with great interest the article by Munyon et al1 addressing recent developments in perioperative medicine. We would like to comment on the perioperative interruption of dual antiplatelet therapy, a common clinical problem.
Several registry analyses have shown that, with second-generation drug-eluting stents, interruption of 1 antiplatelet agent after the first month is safe.2,3 These registries included a substantial proportion of patients whose index stenting procedure was performed for acute coronary syndrome (up to 60%).2 On average, antiplatelet therapy interruption was brief (about 6 to 7 days).
Additional registry analyses have shown that surgery may be safely performed beyond the first month after drug-eluting stent placement.4,5 Specifically, a large Danish analysis of patients with a drug-eluting stent who underwent noncardiac surgery, matched to control patients without ischemic heart disease, showed that the risk of perioperative myocardial infarction and death was not increased beyond the first month after drug-eluting stent implantation. Specifically, the risk was not increased at the 1- to 2-month and 2- to 12-month postimplantation intervals. Acute coronary syndrome was the indication for stenting in 56% of the patients.
Therefore, while surgery is preferably delayed 6 months after drug-eluting stent implantation (class I recommendation in the European Society of Cardiology guidelines), surgery may be selectively performed 1 to 6 months after drug-eluting stent implantation with an acceptable risk. This is particularly so if the index stenting was performed in the setting of stable coronary arterial disease (class IIa recommendation if stenting was performed in the setting of stable coronary arterial disease without complex procedural features; class IIb recommendation if stenting was performed in the setting of acute coronary syndrome or complex procedural features).6 After drug-eluting stent implantation, the earliest cutpoint for considering surgery is 1 month rather than 3 months.
When surgery is performed within this 1- to 6-month interval, thienopyridine interruption should be kept brief and dual antiplatelet therapy reinitiated as soon as possible postoperatively. In fact, when thienopyridine therapy is interrupted 1 to 6 months after drug-eluting stent implantation, stent thrombosis typically occurs more than 6 or 7 days after interruption.7
References
Munyon R, Cohn SL, Slawski B, Smetana GW, Pfeifer K. 2017 update in perioperative medicine: 6 questions answered. Cleve Clin J Med 2017; 84(11):863–872. doi:10.3949/ccjm.84a.17068
Ferreira-Gonzáles, Marsal JR, Ribera A, et al. Double antiplatelet therapy after drug-eluting stent implantation: risk associated with discontinuation within the first year. J Am Coll Cardiol 2012; 60(15):1333–1339. doi:10.1016/j.jacc.2012.04.057
Naidu SS, Krucoff MW, Rutledge DR, et al. Contemporary incidence and predictors of stent thrombosis and other major adverse cardiac events in the year after XIENCE V implantation: results from the 8,061-patient XIENCE V United States study. JACC Cardiovasc Interv 2012; 5(5):626–635. doi:10.1016/j.jcin.2012.02.014
Egholm G, Kristensen SD, Thim T, et al. Risk associated with surgery within 12 months after coronary drug-eluting stent implantation. J Am Coll Cardiol 2016; 68(24):2622–2632. doi:10.1016/j.jacc.2016.09.967
Singla S, Sachdeva R, Uretsky BF. The risk of adverse cardiac and bleeding events following noncardiac surgery relative to antiplatelet therapy in patients with prior percutaneous coronary intervention. J Am Coll Cardiol 2012; 60(20):2005–2016. doi:10.1016/j.jacc.2012.04.062
Valgimigli M, Bueno H, Byrne RA, et al. 2017 ESC focused update on dual antiplatelet therapy in coronary artery disease developed in collaboration with EACTS: The Task Force for dual antiplatelet therapy in coronary artery disease of the European Society of Cardiology (ESC) and of the European Association for Cardio-Thoracic Surgery (EACTS). Eur Heart J 2018; 39(3):213–260. doi:10.1093/eurheartj/ehx419
Airoldi F, Colombo A, Morici N, et al. Incidence and predictors of drug-eluting stent thrombosis during and after discontinuation of thienopyridine treatment. Circulation 2007; 116(7):745–754. doi:10.1161/CIRCULATIONAHA.106.686048
dual antiplatelet therapy, DAPT, drug-eluting stent, DES, surgery, perioperative care, perioperative bridging, European Society of Cardiology, ESC, guidelines, Elias Hanna, Eliana Deschamps
To the Editor: We read with great interest the article by Munyon et al1 addressing recent developments in perioperative medicine. We would like to comment on the perioperative interruption of dual antiplatelet therapy, a common clinical problem.
Several registry analyses have shown that, with second-generation drug-eluting stents, interruption of 1 antiplatelet agent after the first month is safe.2,3 These registries included a substantial proportion of patients whose index stenting procedure was performed for acute coronary syndrome (up to 60%).2 On average, antiplatelet therapy interruption was brief (about 6 to 7 days).
Additional registry analyses have shown that surgery may be safely performed beyond the first month after drug-eluting stent placement.4,5 Specifically, a large Danish analysis of patients with a drug-eluting stent who underwent noncardiac surgery, matched to control patients without ischemic heart disease, showed that the risk of perioperative myocardial infarction and death was not increased beyond the first month after drug-eluting stent implantation. Specifically, the risk was not increased at the 1- to 2-month and 2- to 12-month postimplantation intervals. Acute coronary syndrome was the indication for stenting in 56% of the patients.
Therefore, while surgery is preferably delayed 6 months after drug-eluting stent implantation (class I recommendation in the European Society of Cardiology guidelines), surgery may be selectively performed 1 to 6 months after drug-eluting stent implantation with an acceptable risk. This is particularly so if the index stenting was performed in the setting of stable coronary arterial disease (class IIa recommendation if stenting was performed in the setting of stable coronary arterial disease without complex procedural features; class IIb recommendation if stenting was performed in the setting of acute coronary syndrome or complex procedural features).6 After drug-eluting stent implantation, the earliest cutpoint for considering surgery is 1 month rather than 3 months.
When surgery is performed within this 1- to 6-month interval, thienopyridine interruption should be kept brief and dual antiplatelet therapy reinitiated as soon as possible postoperatively. In fact, when thienopyridine therapy is interrupted 1 to 6 months after drug-eluting stent implantation, stent thrombosis typically occurs more than 6 or 7 days after interruption.7
References
Munyon R, Cohn SL, Slawski B, Smetana GW, Pfeifer K. 2017 update in perioperative medicine: 6 questions answered. Cleve Clin J Med 2017; 84(11):863–872. doi:10.3949/ccjm.84a.17068
Ferreira-Gonzáles, Marsal JR, Ribera A, et al. Double antiplatelet therapy after drug-eluting stent implantation: risk associated with discontinuation within the first year. J Am Coll Cardiol 2012; 60(15):1333–1339. doi:10.1016/j.jacc.2012.04.057
Naidu SS, Krucoff MW, Rutledge DR, et al. Contemporary incidence and predictors of stent thrombosis and other major adverse cardiac events in the year after XIENCE V implantation: results from the 8,061-patient XIENCE V United States study. JACC Cardiovasc Interv 2012; 5(5):626–635. doi:10.1016/j.jcin.2012.02.014
Egholm G, Kristensen SD, Thim T, et al. Risk associated with surgery within 12 months after coronary drug-eluting stent implantation. J Am Coll Cardiol 2016; 68(24):2622–2632. doi:10.1016/j.jacc.2016.09.967
Singla S, Sachdeva R, Uretsky BF. The risk of adverse cardiac and bleeding events following noncardiac surgery relative to antiplatelet therapy in patients with prior percutaneous coronary intervention. J Am Coll Cardiol 2012; 60(20):2005–2016. doi:10.1016/j.jacc.2012.04.062
Valgimigli M, Bueno H, Byrne RA, et al. 2017 ESC focused update on dual antiplatelet therapy in coronary artery disease developed in collaboration with EACTS: The Task Force for dual antiplatelet therapy in coronary artery disease of the European Society of Cardiology (ESC) and of the European Association for Cardio-Thoracic Surgery (EACTS). Eur Heart J 2018; 39(3):213–260. doi:10.1093/eurheartj/ehx419
Airoldi F, Colombo A, Morici N, et al. Incidence and predictors of drug-eluting stent thrombosis during and after discontinuation of thienopyridine treatment. Circulation 2007; 116(7):745–754. doi:10.1161/CIRCULATIONAHA.106.686048
Perioperative interruption of dual antiplatelet therapy
Display Headline
Perioperative interruption of dual antiplatelet therapy
Legacy Keywords
dual antiplatelet therapy, DAPT, drug-eluting stent, DES, surgery, perioperative care, perioperative bridging, European Society of Cardiology, ESC, guidelines, Elias Hanna, Eliana Deschamps
Legacy Keywords
dual antiplatelet therapy, DAPT, drug-eluting stent, DES, surgery, perioperative care, perioperative bridging, European Society of Cardiology, ESC, guidelines, Elias Hanna, Eliana Deschamps
Figure 1.When the ST segment is elevated on the electrocardiogram, our first concern is whether the patient is having an ST-segment elevation myocardial infarction (STEMI). However, a number of other conditions can cause ST elevation, and to complicate matters, some of these can coexist with STEMI.
Nevertheless, careful attention to the ST-T and QRS-complex configurations often allows diagnosis of the cause of ST elevation (Figure 1, Table 1). This paper discusses the differential diagnosis of ST elevation.
MEASURED AT THE J POINT OR LATER
ST-segment deviation is usually measured at its junction with the end of the QRS complex, ie, the J point, and is referenced against the TP or PR segment.1 Some authors prefer measuring the magnitude of the ST deviation 40 to 80 msec after the J point, when all myocardial fibers are expected to have reached the same level of membrane potential and to form an isoelectric ST segment.2,3
ST-SEGMENT ELEVATION MYOCARDIAL INFARCTION
A diagnosis of STEMI that mandates emergency reperfusion requires ST elevation equaling or exceeding the following cut-points, in at least two contiguous leads (using the standardization of 1.0 mV = 10 mm)4,5:
1 mm in all standard leads other than V2 and V3
2.5 mm in leads V2 and V3 in men younger than age 40, 2 mm in leads V2 and V3 in men age 40 and older, and 1.5 mm in these leads in women
0.5 mm in the posterior chest leads V7 to V9; ST elevation is attenuated in the posterior leads because of their greater distance from the heart, explaining the lower cut-point.6
While ST elevation that falls below these cut-points may be a normal variant, any ST elevation or depression (≥ 0.5 mm) may be abnormal and may necessitate further evaluation for ischemia, particularly when the clinical setting or the ST morphology suggests ischemia or when other signs of ischemia such as T-wave abnormalities, Q waves, or reciprocal ST-segment changes are also present on the electrocardiogram.
Conversely, ST elevation that exceeds these cut-points may not represent STEMI. In an analysis of patients with chest pain manifesting ST elevation, only 15% were eventually diagnosed with STEMI.7 In addition to size, careful attention to the morphology of the ST segment and the associated features is critical (Figure 1).
Other features of STEMI
Figure 2. Diffuse ST-segment elevation with ST-segment depression in lead aVR. This initially suggests pericarditis. PR depression in leads II, aVF, V5, and V6 further suggests pericarditis. But the presence of features of pericarditis does not necessarily rule out STEMI. The five STEMI features must be ruled out. In this case, the ST-segment morphology and the abnormally wide T wave are features of STEMI. The ST elevation has an upwardly convex shape with a wide and high T wave fused with the ST segment, typical of STEMI (leads V2–V4, arrows). Also, the size of the ST elevation (ie, > 5 mm in V2–V4 and larger than the QRS complex in V4, a feature called “tombstoning”) is more consistent with STEMI than with pericarditis. In this patient, the left anterior descending artery was found to be occluded on coronary arteriography.In STEMI, the ST elevation is typically a convex or a straight oblique line, blending with a wide T wave to form a dome.8 But ST elevation may be concave in up to 40% of anterior STEMIs, especially in the early stage.3,9,10 The nonconcave morphology is highly specific but not sensitive for the diagnosis of anterior STEMI.3,8,9
Four other features characteristic of STEMI may be present (Figures 2 and 3):
Concomitant T-wave abnormalities (wide, ample, or inverted T waves)
Q waves
ST depression in the reciprocal leads. Reciprocal ST depression is seen in all inferior STEMIs and in 70% of anterior STEMIs.11,12 Diffuse ST elevation mimicking pericarditis may be seen with midvessel occlusion of a left anterior descending artery that wraps around the apex and supplies part of the inferior wall.
Figure 3. In a patient with lung cancer, sinus tachycardia is seen with diffuse ST-segment elevation, along with ST-segment depression in aVR. The QRS voltage is low, particularly when compared with the electrocardio-gram recorded a few days earlier (left lower panel). PR depression is seen in lead II. The combination of these findings may suggest pericarditis with a pericardial effusion. However, the ST-T morphology in lead V2, where the ST and T are blended to form one dome, is characteristic of STEMI (top arrow). Moreover, the ST elevation and T wave in leads V2–V4 are larger than the QRS, the QRS voltage is “shrinking” (arrowhead), and the R wave is pulled up by the ST segment (star); this is called “tombstoning.” All these features are characteristic of STEMI, wherein the R wave and the QRS complex shrink before forming a deep Q wave. In fact, an electrocardiogram recorded 1 hour later (right lower panel) shows a fully developed Q wave in lead V2 (bottom arrow).ST or T-wave amplitude may approximate or exceed the QRS amplitude in at least one lead.3,13,14 This finding is characteristic of STEMI, in which the QRS “shrinks” as the infarcted area becomes electrically neutral, whereas the ST-T segments become ample.3,13 In fact, early STEMI may be characterized by a small R wave that seems to be “pulled up” by the elevated ST segment. A small or absent R wave along with an ample, convex ST segment that fuses with the T wave and exceeds the height of the remaining R wave is called “tombstoning” (Figure 3). Tombstoning is most commonly seen with anterior infarction and implies more extensive myocardial damage and a worse prognosis than STEMI without tombstoning.15
Note that ST elevation may not be acute STEMI but an old STEMI with a chronically dysfunctional myocardium (dyskinetic or aneurysmal myocardium). In fact, an old STEMI may manifest as a chronic, persistent ST elevation along with Q waves, and T waves may be inverted or upright, but not ample.14 A history of an old MI, old electrocardiograms, if available, and quick bedside echocardiography may allow the diagnosis. In the case of an old dyskinetic infarct, echocardiography shows a thin, bright (scarred), and possibly aneurysmal myocardium, whereas in acute STEMI, the myocardium is neither thin nor scarred yet. If the patient does not report a history of MI, if the T wave is ample (> 75% the size of QRS), or if the patient presents with atypical ongoing angina, presume it is acute STEMI.
EARLY REPOLARIZATION
Early repolarization is a normal variant of ST elevation that equals or exceeds 1 mm (measured at the J point). It is highly prevalent in people under age 40 and remains prevalent in middle-aged people.
Two distinct and sometimes coexistent forms of early repolarization have been described: (1) ST elevation in the anterior leads V1 to V3,16–19 and (2) ST elevation in the lateral leads (V4 to V6, I, aVL) or inferior leads.18–22 The prevalence of the first form—ie, ST elevation of 1 mm or more in any of the leads V1 through V3—is 60% to 90% in men age 45 and younger, 20% to 40% in men over age 45, and about 10% in women of any age.16 Thus, this form of early repolarization is called “normal male pattern.”
Even early repolarization that involves the lateral or inferior leads is common, with a prevalence of about 15% in people ages 30 to 40 and about 5% to 10% in those 40 to 65.20–23 It is two to four times more prevalent in men and three times more prevalent in African Americans. It is also highly prevalent in athletes younger than 25 (about 30% to 40%).22
Figure 4. Early repolarization with ST-segment elevation is seen in the inferior leads and in the anterolateral leads V2 to V6. ST elevation is most prominent in lead V4 and lead II, with a concavely upward ST morphology and a notch at the J point (arrows and left magnified image). In half of early repolarization cases, the J point is smooth but well demarcated (right magnified image). Note the slight PR depression in leads II and V5. Slight PR depression may be seen in normal individuals and corresponds to the normal atrial repolarization.Either way, early repolarization closely resembles the ST elevation of pericarditis and has the following features (Figure 4):
The ST segment is concave upward, and the J point is well demarcated and may be notched or slurred (Figure 1).
ST elevation is usually no more than 3 mm.
ST elevation may be limited to the anterior leads or, in many instances, may extend to the inferior or lateral leads. Early repolarization is very rarely limited to the limb leads, and involvement of some precordial leads is the rule.18,19 The ST segment is depressed in lead aVR in 50% of patients.18,19
Figure 5. Early repolarization with a normal variant T-wave inversion in a 33-year-old black man. The ST segment is elevated with a notched J point in leads V2 to V5The T wave is usually ample and may be more than 10 mm tallin the precordial leads in one-third of patients,17 but as opposed to the ample T wave of STEMI, it is not broad and remains smaller than the QRS complex. The ample T wave distinguishes early repolarization from pericarditis, and explains the low ST-T ratio in lead V6. In up to 10% of young black men, the T wave has a terminal inversion in leads V3 to V5, and occasionally in V1 and V2, mimicking infarction(Figure 5).24
The QRS complex tends to have prominent precordial voltage, in sharp contrast to STEMI, in which QRS shrinking occurs.3,17,22
The early repolarization pattern may be intermittent, may vary among serial electrocardiograms, may decrease with a rise in sympathetic tone, as observed during exercise, and may increase with a rise in vagal tone.18,19,25,26 Although it is usually a benign finding, the early repolarization pattern in leads other than V1 to V3 has been associated with an increased risk of sudden death, particularly when the ST elevation is horizontal-descending rather than upsloping and, possibly, when early repolarization involves the inferior leads with a J point that is notched or elevated 2 mm or more.20,22
PERICARDITIS
Figure 6. Diffuse ST-segment elevation in most leads, with ST depression in lead aVR and an isoelectric ST segment in V1. None of the STEMI features are present: ST elevation is concave upward, no reciprocal ST depression is seen except in lead aVR; the T wave is not wide, inverted, or ample (in relation to the QRS complex); and no Q wave is seen. Furthermore, ST elevation does not exceed 5 mm; ST and T heights are smaller than QRS height; and PR depression is present (circled areas). As opposed to early repolarization, the ratio of ST to T in leads V5 and V6 exceeds 25%. This is consistent with pericarditis, and the hospital course of this patient confirmed this diagnosis.In pericarditis, ST elevation is concave upward and is widespread to more than one region without reciprocal ST depression, except for the frequent ST depression in leads aVR and V1 (64%)27; ST elevation is seldom greater than 4 to 5 mm (Figure 6).27,28 Since the subepicardial injury is diffuse in pericarditis, the axis of the ST segment follows the anatomic axis of the heart and is generally +45° in the frontal plane. Thus, ST depression is seen in leads aVR and V1; ST elevation is highest in leads II, V5, and V6 and is less in leads III and aVL, where the ST segment may occasionally be depressed.29
Transient PR depression greater than 1 mm is often seen, particularly in leads II, aVF, and V4 to V6, and represents atrial subepicardial injury. PR depression in those leads is always associated with PR elevation in lead aVR and sometimes V1. PR changes often coexist with ST changes but may be isolated and may precede ST changes.30 PR depression is characteristic of pericarditis but may be seen in early repolarization, where it is less marked than in pericarditis (< 0.8 mm) and implies early repolarization of the atrial tissue,31 and in MI, where it implies atrial infarction with atrial injury pattern.
Classically, it is said that in pericarditis, unlike in STEMI, the T wave does not invert until the ST elevation subsides. In reality, up to 40% of patients develop a notched or biphasic positive-negative T wave before full return of the ST segment to the baseline.27,32 And if T-wave inversion antedates pericarditis, concomitant ST elevation and T-wave inversion may be seen once pericarditis develops. However, the T wave inverts less deeply and less completely than in STEMI, and the corrected QT interval remains normal even when the T wave inverts.
Three criteria distinguish pericarditis from early repolarization (but not from STEMI):
PR depression greater than 1 mm
ST-segment depression in lead V1
A ratio of ST-segment height to T-wave height of at least 25% in lead V6, V5, V4, or I. This feature distinguishes pericarditis from early repolarization with a high sensitivity and specificity. In pericarditis, the T waves have normal or reduced amplitude, and the ST-T ratio is therefore high,33 whereas in early repolarization the T waves are tall, so the ST-T ratio is less than 25%.
Widespread ST elevation may be seen with both pericarditis and early repolarization. ST elevation limited to the anterior leads is more likely to be early repolarization than pericarditis.
LEFT BUNDLE BRANCH BLOCK
Figure 7. Supraventricular tachycardia with a typical left bundle branch block pattern in leads I and aVL. Concordant ST-segment elevation is seen in leads I and aVL, while concordant ST depression is seen in the inferior leads (arrows). The ST elevation in lead V2 is discordant but is disproportionately high in relation to the QRS (well above 25% of the QRS height). All these features are diagnostic of STEMI.In left bundle branch block, a deep and wide S wave is seen in leads V1 to V3 and sometimes in the inferior leads, with ST elevation and T waves that are discordant with the QRS complex—ie, directed opposite to the QRS (Figures 7–9). The ST elevation is typically concave upward.8,34 Occasionally, ST elevation may be straight or convex, mimicking the dome of STEMI. In the lateral leads, the discordant ST segment is depressed, mimicking a reciprocal ST change.
The following findings imply MI:
Figure 8. Left bundle branch block with discordant ST-segment changes. However, the T wave is wide and fused with the ST segment in a domed morphology, and the T wave is larger than the QRS in leads V4, V5, and II (arrows). This implies the diagnosis of STEMI with hyperacute T waves. This patient had an occluded left anterior descending coronary artery.ST elevation or depression that is concordant with the QRS complex. Moreover, since ST deviation is mandatory with left bundle branch block, a “normal-looking” ST segment implies ischemia.
Inverted T waves concordant with the QRS in more than one lead, or biphasic T waves in more than one lead (eg, V1 to V3). Across the precordial leads, T waves may transition from positive to negative one lead earlier or later than the QRS and ST transition. Therefore, even in the absence of ischemia, the T wave may be inverted in lead V3, in which the QRS is deeply negative and the ST is still elevated (negative T-wave concordance in one lead). Also, the T wave may be upright in leads V5, V6, and I where QRS is upright and the ST segment is depressed (positive T-wave concordance does not imply ischemia).
Figure 9. Left bundle branch block with abnormal T waves. Panels A and B show discordant ST-segment elevation in V1 to V3 but concordant T wave inversion (A) or biphasic T wave (B). This is consistent with an anterior injury pattern. Panel C shows concordant T-wave inversion in the inferior leads, consistent with inferior injury. Panel D shows a large concordant T wave in lead V6, larger than the QRS, consistent with injury.In addition to concordance, a discordant ST segment or T wave that is very large may imply ischemia. For example, a discordant ST segment or T wave that is larger than the QRS height implies ischemia. A discordant ST elevation greater than 5 mm has been suggested by Sgarbossa et al35 as a diagnostic feature of STEMI; however, this feature is seen in 10% of control patients with left bundle branch block and no STEMI, and it is thus poorly specific and also poorly sensitive, frequently missing STEMI.35–37 Smith et al36 have suggested that a discordant ST elevation of at least 25% of the S-wave depth is a far more sensitive and accurate feature but one that may still be found in up to 10% of control patients.36
LEFT VENTRICULAR HYPERTROPHY
In left ventricular hypertrophy, a deep S wave is seen in leads V1 to V3, with ST elevation and T waves that are discordant with the QRS complex. Rarely, ST elevation may be straight or convex. The following findings imply MI:
ST elevation or depression that is concordant with the QRS.
Inverted T waves that are concordant with the QRS in more than one lead, or biphasic T waves in more than one lead (eg, V1 to V3).
A discordant ST segment or a T wave that is very large may imply ischemia. In left ventricular hypertrophy, ST elevation is usually less than 2.5 mm in leads V1 to V3 and is rarely seen in the inferior leads, where it would be less than 1 mm.34 When ST elevation is seen in leads V1 to V3 in left ventricular hypertrophy, an ST magnitude of 25% or more of the total QRS voltage has a 91% specificity for STEMI.34
On another note, right ventricular hypertrophy and right bundle branch block may lead to ST-segment depression and T-wave inversion, but not to ST elevation. Thus, ST elevation occurring with right ventricular hypertrophy or right bundle branch block implies STEMI. While only left bundle branch block poses a diagnostic challenge, both types of bundle branch block, if secondary to STEMI, represent equally high-risk categories.38
PREEXCITATION
Figure 10. At first glance, it seems there is ST-segment elevation in the inferior leads II, III, and aVF, with a wide Q wave. Moreover, there is a wide and tall R wave in lead V1 suggesting an associated posterior infarction. All this is consistent with acute inferoposterior STEMI. On further analysis, however, a slur is seen on the upslope of QRS in leads V1 to V6 (arrows), and the P wave is “riding” this slur. In the inferior leads, the P wave is riding the Q wave, which is in fact a negative delta wave. Thus, this electrocardiogram represents preexcitation. The ST deviations are secondary to the preexcitation and have an orientation opposite to the delta wave.Preexcitation may be associated with negative delta waves that mimic Q waves, and with ST elevation in the leads where the negative delta waves are seen, ie, ST elevation discordant with the delta wave (Figure 10). The QRS morphology and the delta wave allow preexcitation to be distinguished from STEMI.
HYPERKALEMIA
Figure 11. There are ST-segment elevations in leads V1–V4, ST-segment depressions in the inferior leads, and peaked T waves in leads V3–V5. These T waves have a narrow base and seem to “pull” the ST segment, creating ST elevation in the anterior leads and ST depression in the inferior leads (arrows). This shape is consistent with hyperkalemia. In addition, the downsloping ST elevation seen in V1 and V2 is consistent with hyperkalemia (arrowhead). Occasionally, STEMI may have a similar ST-T shape. An rSR’ pattern is seen in V1–V2; this is consistent with STEMI but also with hyperkalemia, in which conduction blocks are common. The serum potassium level was 7.4 mmol/L (normal 3.5–5), and coronary angiography revealed normal coronary arteries.The most common finding in hyperkalemia is a peaked, narrow-based T wave that is usually, but not necessarily, tall. ST elevation may be evident in leads V1 to V3 (Figure 11). In contrast with hyperkalemia, the T wave of STEMI is typically wide.
OTHER CAUSES OF ST-SEGMENT ELEVATION
Takotsubo cardiomyopathy
Takotsubo cardiomyopathy mimics all electrocardiographic features of anteroapical STEMI. ST elevation may extend to the inferior leads but cannot be isolated in the inferior leads.39 As in apical STEMI, reciprocal ST depression is uncommon. Within 24 to 48 hours, ST elevation evolves into deep anterior T-wave inversion and a prolonged QT interval. Transient Q waves may be seen.
Myocarditis
Myocarditis may have one of two electrocardiographic patterns: a pericarditis pattern, or a typical STEMI pattern with Q waves sometimes localized to one area.40
Atrial flutter waves
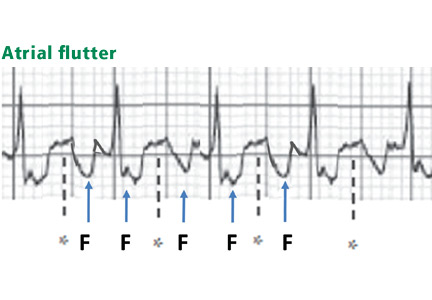
Figure 12. Atrial flutter that simulates ST-segment elevation. An “F” indicates the negative flutter wave; an asterisk indicates the upslope of the flutter wave that is superimposed on the ST segment, mimicking ST elevation.Atrial flutter waves, particularly of 2:1 atrial flutter, may deform the ST segment so that it mimics an injury pattern on the electrocardiogram. Flutter waves may mimic ST elevation or ST depression (Figure 12).
Large pulmonary embolism
A large pulmonary embolism may be associated with T-wave inversion in the anterior leads or the inferior leads, or both, reflective of cor pulmonale. Less commonly, ST elevation in the anterior or inferior leads is seen. In fact, changes of both anterior and inferior ischemia should always suggest a pulmonary embolism.41,42
Brugada syndrome
Figure 13. Type 1 Brugada pattern in V1 and V1, with a downsloping ST-segment elevation that creates a pseudo-R’ wave (pseudo-right bundle branch block). The QRS does not have a right bundle branch block morphology in leads V5 and V6.Brugada syndrome is characterized by ST elevation and a right bundle branch block or pseudo-right bundle branch block pattern in at least two of the leads V1 to V3. In pseudo-right bundle branch block, the QRS adopts an rSR morphology in the anterior leads but is normal in the lateral leads. Type 1 Brugada pattern, the pattern that is most specifically associated with sudden death, is characterized by a coved, downsloping ST elevation of 2 mm or more with T-wave inversion (Figure 13).43 The Brugada pattern can be transient, triggered by fever, cocaine, or class I antiarrhythmic drugs.
Hyperkalemia, Brugada syndrome, and sometimes pulmonary embolism are characterized by an ST elevation that slopes downward (Figures 11 and 13), which contrasts with the upsloping, convex ST elevation of STEMI.
References
Rautaharju PM, Surawicz B, Gettes LS, et al; American Heart Association Electrocardiography and Arrhythmias Committee, Council on Clinical Cardiology; American College of Cardiology Foundation; Heart Rhythm Society. AHA/ACCF/HRS recommendations for the standardization and interpretation of the electrocardiogram: part IV: the ST-segment, T and U waves, and the QT interval: a scientific statement from the American Heart Association Electrocardiography and Arrhythmias Committee, Council on Clinical Cardiology; the American College of Cardiology Foundation; and the Heart Rhythm Society. Endorsed by the International Society for Computerized Electrocardiology. J Am Coll Cardiol 2009; 53:982–991.
Surawicz B, Knilans TK. Chou’s Electrocardiography in Clinical Practice: Adult and Pediatric. 5th ed. Philadelphia, PA: WB Saunders; 2001:194–207.
Smith SW, Khalil A, Henry TD, et al. Electrocardiographic differentiation of early repolarization from subtle anterior ST-segment elevation myocardial infarction. Ann Emerg Med 2012; 60:45–56.e2.
American College of Emergency Physicians; Society for Cardiovascular Angiography and Interventions; O’Gara PT, Kushner FG, Ascheim DD, et al. 2013 ACCF/AHA guideline for the management of ST-elevation myocardial infarction: a report of the American College of Cardiology Foundation/American Heart Association Task Force on Practice Guidelines. J Am Coll Cardiol 2013; 61:e78–e140.
Thygesen K, Alpert JS, Jaffe AS, et al; Joint ESC/ACCF/AHA/WHF Task Force for the Universal Definition of Myocardial Infarction. Third universal definition of myocardial infarction. Circulation 2012; 126:2020–2035.
Matetzky S, Freimark D, Chouraqui P, et al. Significance of ST segment elevations in posterior chest leads (V7 to V9) in patients with acute inferior myocardial infarction: application for thrombolytic therapy. J Am Coll Cardiol 1998; 31:506–511.
Brady WJ, Perron AD, Martin ML, Beagle C, Aufderheide TP. Cause of ST-segment abnormality in ED chest pain patients. Am J Emerg Med 2001; 19:25–28.
Brady WJ, Syverud SA, Beagle C, et al. Electrocardiographic ST-segment elevation: the diagnosis of acute myocardial infarction by morphologic analysis of the ST segment. Acad Emerg Med 2001; 8:961–967.
Smith SW. Upwardly concave ST-segment morphology is common in acute left anterior descending coronary occlusion. J Emerg Med 2006; 31:69–77.
Kosuge M, Kimura K, Ishikawa T, et al. Value of ST-segment elevation pattern in predicting infarct size and left ventricular function at discharge in patients with reperfused acute anterior myocardial infarction. Am Heart J 1999; 137:522–527.
Birnbaum Y, Sclarovsky S, Mager A, Strasberg B, Rechavia E. ST segment depression in a VL: a sensitive marker for acute inferior myocardial infarction. Eur Heart J 1993; 14:4–7.
Engelen DJ, Gorgels AP, Cheriex EC, et al. Value of the electrocardiogram in localizing the occlusion site in the left anterior descending coronary artery in acute anterior myocardial infarction. J Am Coll Cardiol 1999; 34:389–395.
Collins MS, Carter JE, Dougherty JM, Majercik SM, Hodsden JE, Logue EE. Hyperacute T-wave criteria using computer ECG analysis. Ann Emerg Med 1990; 19:114–120.
Smith SW. T/QRS ratio best distinguishes ventricular aneurysm from anterior myocardial infarction. Am J Emerg Med 2005; 23:279–287.
Surawicz B, Parikh SR. Prevalence of male and female patterns of early ventricular repolarization in the normal ECG of males and females from childhood to old age. J Am Coll Cardiol 2002; 40:1870–1876.
Klatsky AL, Oehm R, Cooper RA, Udaltsova N, Armstrong MA. The early repolarization normal variant electrocardiogram: correlates and consequences. Am J Med 2003; 115:171–177.
Mehta M, Jain AC, Mehta A. Early repolarization. Clin Cardiol 1999; 22:59–65.
Mehta MC, Jain AC. Early repolarization on scalar electrocardiogram. Am J Med Sci 1995; 309:305–311.
Rollin A, Maury P, Bongard V, et al. Prevalence, prognosis, and identification of the malignant form of early repolarization pattern in a population-based study. Am J Cardiol 2012; 110:1302–1308.
Tikkanen JT, Anttonen O, Junttila MJ, et al. Long-term outcome associated with early repolarization on electrocardiography. N Engl J Med 2009; 361:2529–2537.
Tikkanen JT, Junttila MJ, Anttonen O, et al. Early repolarization: electrocardiographic phenotypes associated with favorable long-term outcome. Circulation 2011; 123:2666–2673.
Noseworthy PA, Tikkanen JT, Porthan K, et al. The early repolarization pattern in the general population: clinical correlates and heritability. J Am Coll Cardiol 2011; 57:2284–2289.
Wasserburger RH. Observations on the juvenile pattern of adult negro males. Am J Med 1955; 18:428–437.
Kralios FA, Martin L, Burgess MJ, Millar K. Local ventricular repolarization changes due to sympathetic nerve-branch stimulation. Am J Physiol 1975; 228:1621–1626.
Spratt KA, Borans SM, Michelson EL. Early repolarization: normalization of the electrocardiogram with exercise as a clinically useful diagnostic feature. J Invasive Cardiol 1995; 7:238–242.
Surawicz B, Lasseter KC. Electrocardiogram in pericarditis. Am J Cardiol 1970; 26:471–474.
Hull E. The electrocardiogram in pericarditis. Am J Cardiol 1961; 7:21–32.
Spodick DH. Diagnostic electrocardiographic sequences in acute pericarditis. Significance of PR segment and PR vector changes. Circulation 1973; 48:575–580.
Spodick DH. Acute pericarditis: current concepts and practice. JAMA 2003; 289:1150–1153.
Charles MA, Bensinger TA, Glasser SP. Atrial injury current in pericarditis. Arch Intern Med 1973; 131:657–662.
Noth PH, Barnes HR. Electrocardiographic changes associated with pericarditis. Arch Intern Med 1940; 65:291–320.
Ginzton LE, Laks MM. The differential diagnosis of acute pericarditis from the normal variant: new electrocardiographic criteria. Circulation 1982; 65:1004–1009.
Armstrong EJ, Kulkarni AR, Bhave PD, et al. Electrocardiographic criteria for ST-elevation myocardial infarction in patients with left ventricular hypertrophy. Am J Cardiol 2012; 110:977–983.
Sgarbossa EB, Pinski SL, Barbagelata A, et al. Electrocardiographic diagnosis of evolving acute myocardial infarction in the presence of left bundle-branch block. GUSTO-1 (Global Utilization of Streptokinase and Tissue Plasminogen Activator for Occluded Coronary Arteries) Investigators. N Engl J Med 1996; 334:481–487.
Smith SW, Dodd KW, Henry TD, Dvorak DM, Pearce LA. Diagnosis of ST-elevation myocardial infarction in the presence of left bundle branch block with the ST-elevation to S-wave ratio in a modified Sgarbossa rule. Ann Emerg Med 2012; 60:766–776.
Madias JE, Sinha A, Agarwal H, Ashtiani R. ST-segment elevation in leads V1-V3 in patients with LBBB. J Electrocardiol 2001; 34:87–88.
Sgarbossa EB, Pinski SL, Topol EJ, et al. Acute myocardial infarction and complete bundle branch block at hospital admission: clinical characteristics and outcome in the thrombolytic era. GUSTO-I Investigators. Global Utilization of Streptokinase and t-PA [tissue-type plasminogen activator] for Occluded Coronary Arteries. J Am Coll Cardiol 1998; 31:105–110.
Bybee KA, Kara T, Prasad A, et al. Systematic review: transient left ventricular apical ballooning: a syndrome that mimics ST-segment elevation myocardial infarction. Ann Intern Med 2004; 141:858–865.
Magnani JW, Dec GW. Myocarditis: current trends in diagnosis and treatment. Circulation 2006; 113:876–890.
Sreeram N, Cheriex EC, Smeets JL, Gorgels AP, Wellens HJ. Value of the 12-lead electrocardiogram at hospital admission in the diagnosis of pulmonary embolism. Am J Cardiol 1994; 73:298–303.
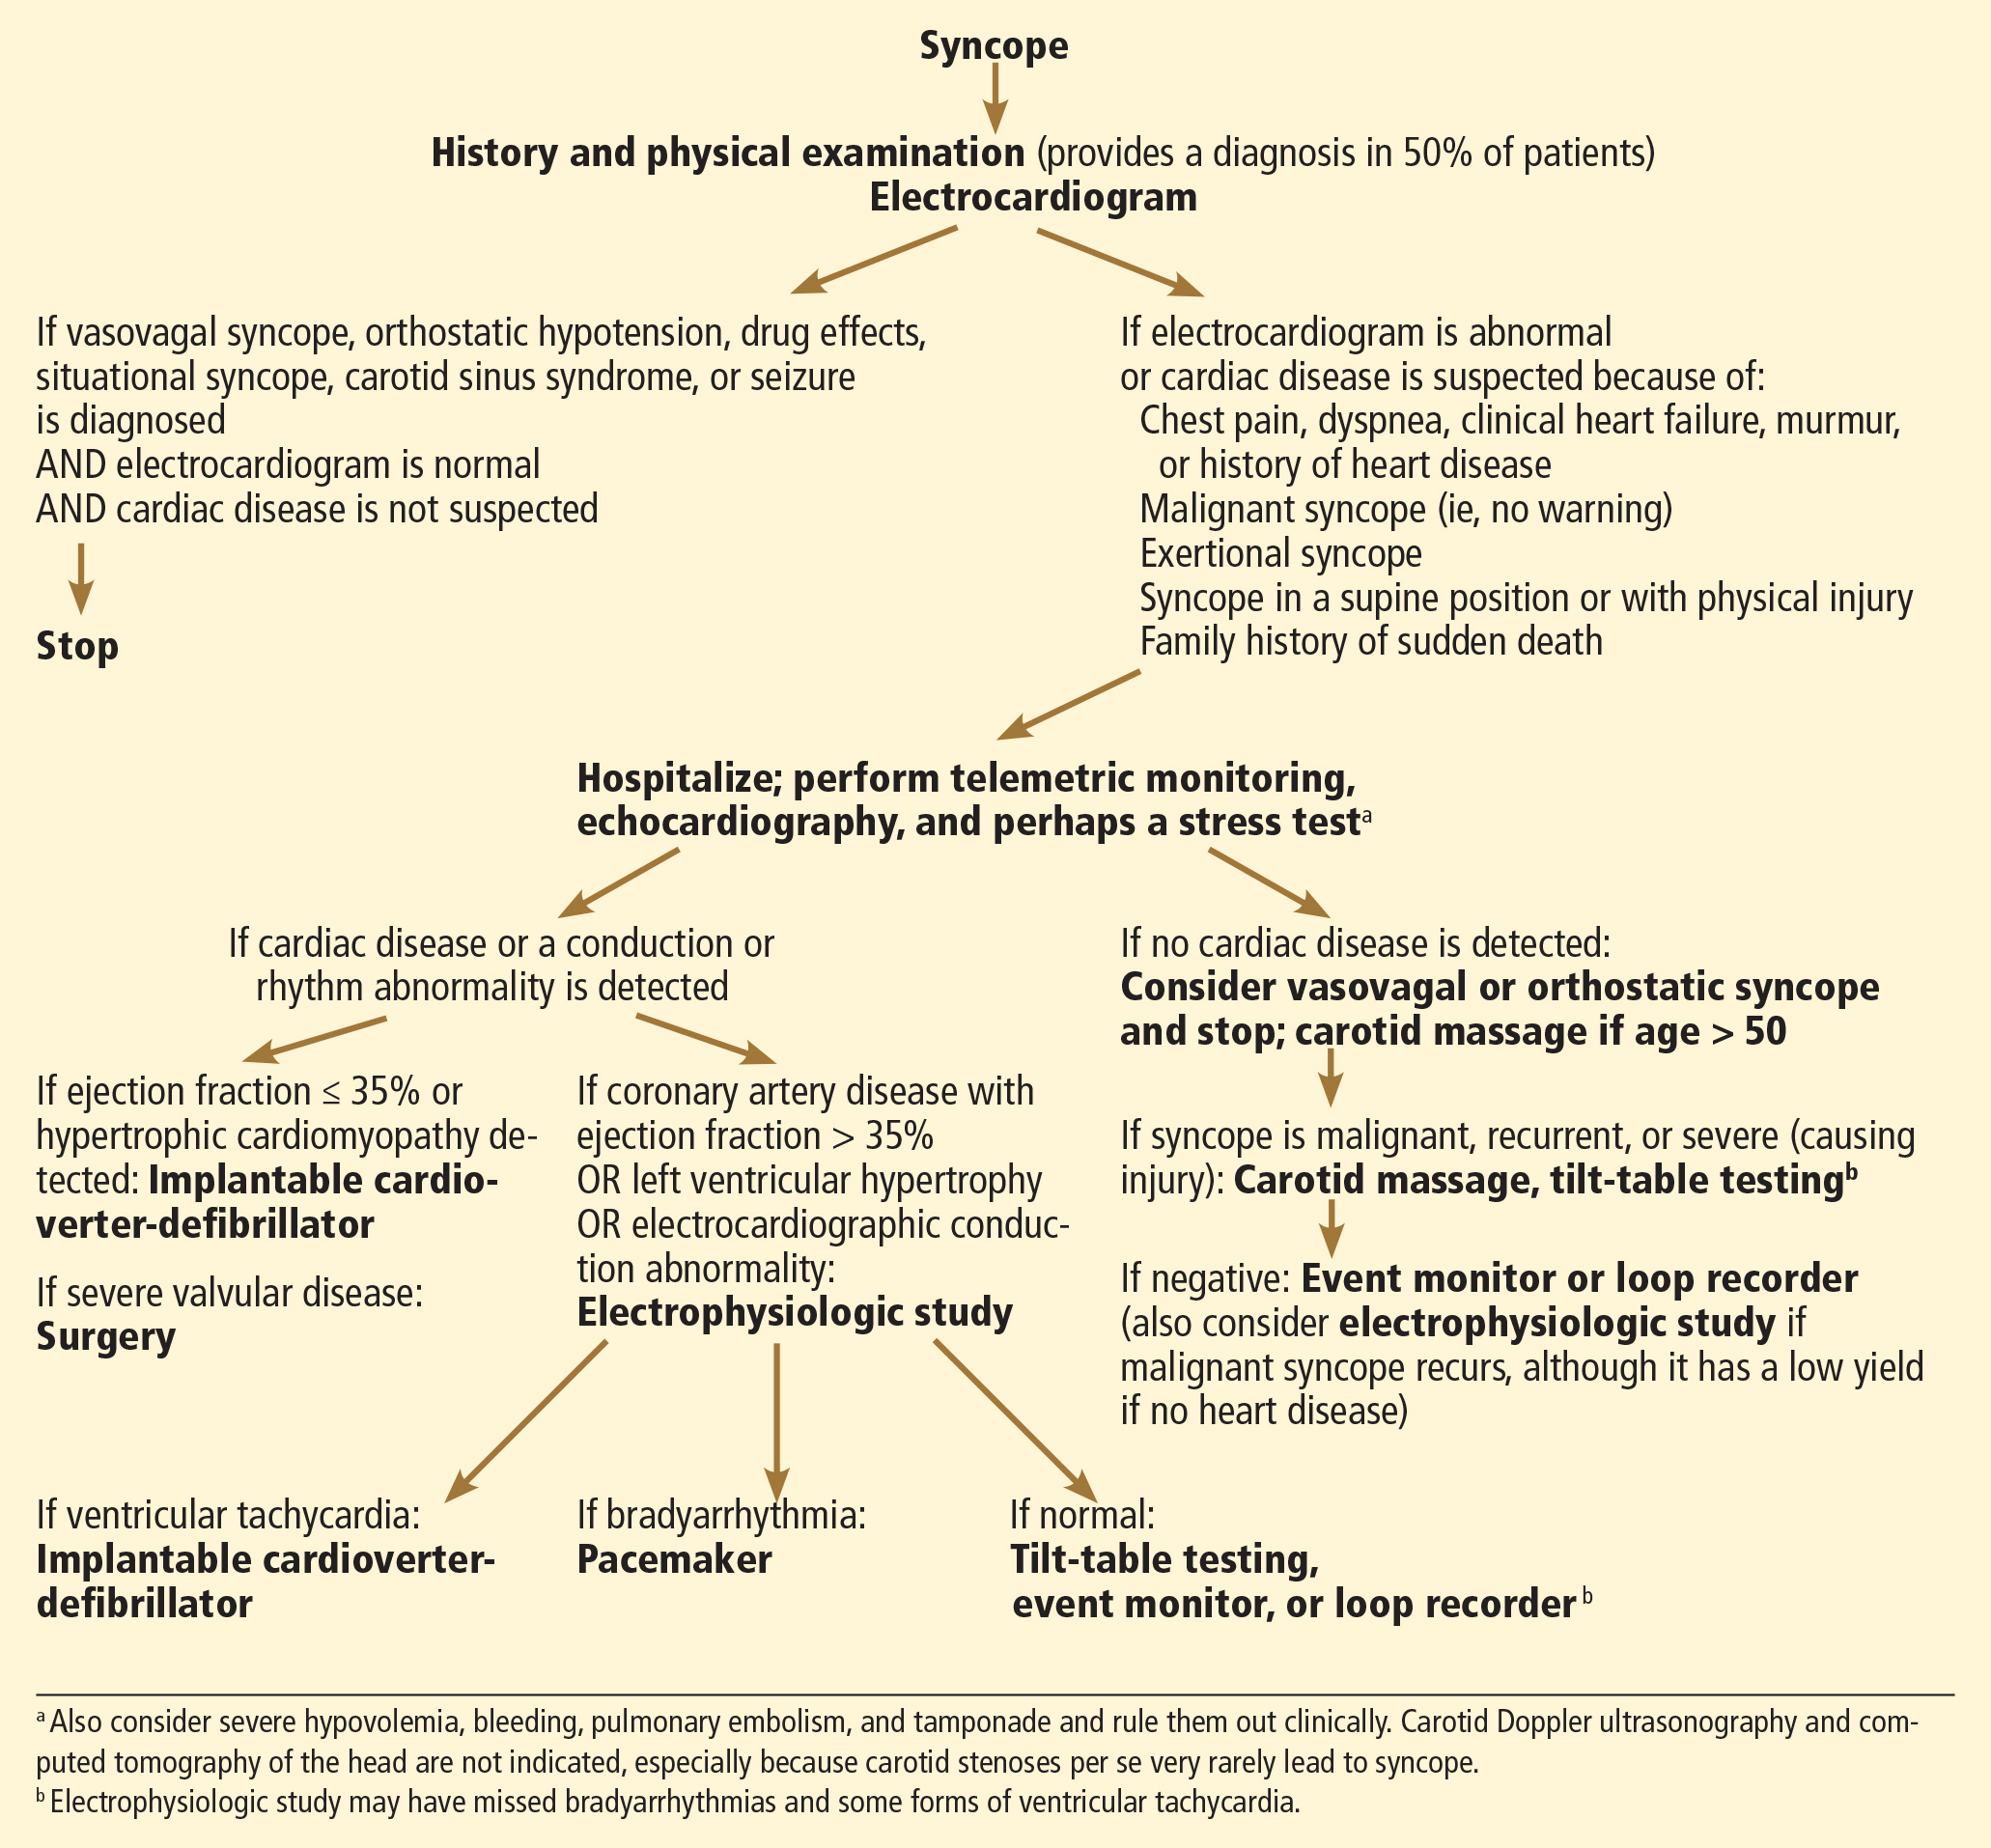
Glancy DL, Mikdadi GM. Syncope in a 67-year-old man. Proc (Bayl Univ Med Cent) 2005; 18:74–75.
Wilde AA, Antzelevitch C, Borggrefe M, et al; Study Group on the Molecular Basis of Arrhythmias of the European Society of Cardiology. Proposed diagnostic criteria for the Brugada syndrome: consensus report. Circulation 2002; 106:2514–2519.
Elias B. Hanna, MD Assistant Professor of Medicine, Department of Medicine, Cardiovascular Section, Louisiana State University Health Sciences Center, New Orleans
David Luke Glancy, MD Emeritus Professor of Medicine, Department of Medicine, Cardiovascular Section, Louisiana State University Health Sciences Center, New Orleans
Address: Elias B. Hanna, MD, Department of Medicine, Cardiovascular Section, Louisiana State University Health Sciences Center, 1542 Tulane Avenue, 3rd Floor, Room 323, New Orleans, LA, 70112; e-mail: ehanna@lsuhsc.edu
ST, ST segment, ST segment elevation, ST elevation myocardial infarction, STEMI, early repolarization, pericarditis, left bundle branch block, hyperkalemia, Elias Hanna, David Glancy
Elias B. Hanna, MD Assistant Professor of Medicine, Department of Medicine, Cardiovascular Section, Louisiana State University Health Sciences Center, New Orleans
David Luke Glancy, MD Emeritus Professor of Medicine, Department of Medicine, Cardiovascular Section, Louisiana State University Health Sciences Center, New Orleans
Address: Elias B. Hanna, MD, Department of Medicine, Cardiovascular Section, Louisiana State University Health Sciences Center, 1542 Tulane Avenue, 3rd Floor, Room 323, New Orleans, LA, 70112; e-mail: ehanna@lsuhsc.edu
Author and Disclosure Information
Elias B. Hanna, MD Assistant Professor of Medicine, Department of Medicine, Cardiovascular Section, Louisiana State University Health Sciences Center, New Orleans
David Luke Glancy, MD Emeritus Professor of Medicine, Department of Medicine, Cardiovascular Section, Louisiana State University Health Sciences Center, New Orleans
Address: Elias B. Hanna, MD, Department of Medicine, Cardiovascular Section, Louisiana State University Health Sciences Center, 1542 Tulane Avenue, 3rd Floor, Room 323, New Orleans, LA, 70112; e-mail: ehanna@lsuhsc.edu
Figure 1.When the ST segment is elevated on the electrocardiogram, our first concern is whether the patient is having an ST-segment elevation myocardial infarction (STEMI). However, a number of other conditions can cause ST elevation, and to complicate matters, some of these can coexist with STEMI.
Nevertheless, careful attention to the ST-T and QRS-complex configurations often allows diagnosis of the cause of ST elevation (Figure 1, Table 1). This paper discusses the differential diagnosis of ST elevation.
MEASURED AT THE J POINT OR LATER
ST-segment deviation is usually measured at its junction with the end of the QRS complex, ie, the J point, and is referenced against the TP or PR segment.1 Some authors prefer measuring the magnitude of the ST deviation 40 to 80 msec after the J point, when all myocardial fibers are expected to have reached the same level of membrane potential and to form an isoelectric ST segment.2,3
ST-SEGMENT ELEVATION MYOCARDIAL INFARCTION
A diagnosis of STEMI that mandates emergency reperfusion requires ST elevation equaling or exceeding the following cut-points, in at least two contiguous leads (using the standardization of 1.0 mV = 10 mm)4,5:
1 mm in all standard leads other than V2 and V3
2.5 mm in leads V2 and V3 in men younger than age 40, 2 mm in leads V2 and V3 in men age 40 and older, and 1.5 mm in these leads in women
0.5 mm in the posterior chest leads V7 to V9; ST elevation is attenuated in the posterior leads because of their greater distance from the heart, explaining the lower cut-point.6
While ST elevation that falls below these cut-points may be a normal variant, any ST elevation or depression (≥ 0.5 mm) may be abnormal and may necessitate further evaluation for ischemia, particularly when the clinical setting or the ST morphology suggests ischemia or when other signs of ischemia such as T-wave abnormalities, Q waves, or reciprocal ST-segment changes are also present on the electrocardiogram.
Conversely, ST elevation that exceeds these cut-points may not represent STEMI. In an analysis of patients with chest pain manifesting ST elevation, only 15% were eventually diagnosed with STEMI.7 In addition to size, careful attention to the morphology of the ST segment and the associated features is critical (Figure 1).
Other features of STEMI
Figure 2. Diffuse ST-segment elevation with ST-segment depression in lead aVR. This initially suggests pericarditis. PR depression in leads II, aVF, V5, and V6 further suggests pericarditis. But the presence of features of pericarditis does not necessarily rule out STEMI. The five STEMI features must be ruled out. In this case, the ST-segment morphology and the abnormally wide T wave are features of STEMI. The ST elevation has an upwardly convex shape with a wide and high T wave fused with the ST segment, typical of STEMI (leads V2–V4, arrows). Also, the size of the ST elevation (ie, > 5 mm in V2–V4 and larger than the QRS complex in V4, a feature called “tombstoning”) is more consistent with STEMI than with pericarditis. In this patient, the left anterior descending artery was found to be occluded on coronary arteriography.In STEMI, the ST elevation is typically a convex or a straight oblique line, blending with a wide T wave to form a dome.8 But ST elevation may be concave in up to 40% of anterior STEMIs, especially in the early stage.3,9,10 The nonconcave morphology is highly specific but not sensitive for the diagnosis of anterior STEMI.3,8,9
Four other features characteristic of STEMI may be present (Figures 2 and 3):
Concomitant T-wave abnormalities (wide, ample, or inverted T waves)
Q waves
ST depression in the reciprocal leads. Reciprocal ST depression is seen in all inferior STEMIs and in 70% of anterior STEMIs.11,12 Diffuse ST elevation mimicking pericarditis may be seen with midvessel occlusion of a left anterior descending artery that wraps around the apex and supplies part of the inferior wall.
Figure 3. In a patient with lung cancer, sinus tachycardia is seen with diffuse ST-segment elevation, along with ST-segment depression in aVR. The QRS voltage is low, particularly when compared with the electrocardio-gram recorded a few days earlier (left lower panel). PR depression is seen in lead II. The combination of these findings may suggest pericarditis with a pericardial effusion. However, the ST-T morphology in lead V2, where the ST and T are blended to form one dome, is characteristic of STEMI (top arrow). Moreover, the ST elevation and T wave in leads V2–V4 are larger than the QRS, the QRS voltage is “shrinking” (arrowhead), and the R wave is pulled up by the ST segment (star); this is called “tombstoning.” All these features are characteristic of STEMI, wherein the R wave and the QRS complex shrink before forming a deep Q wave. In fact, an electrocardiogram recorded 1 hour later (right lower panel) shows a fully developed Q wave in lead V2 (bottom arrow).ST or T-wave amplitude may approximate or exceed the QRS amplitude in at least one lead.3,13,14 This finding is characteristic of STEMI, in which the QRS “shrinks” as the infarcted area becomes electrically neutral, whereas the ST-T segments become ample.3,13 In fact, early STEMI may be characterized by a small R wave that seems to be “pulled up” by the elevated ST segment. A small or absent R wave along with an ample, convex ST segment that fuses with the T wave and exceeds the height of the remaining R wave is called “tombstoning” (Figure 3). Tombstoning is most commonly seen with anterior infarction and implies more extensive myocardial damage and a worse prognosis than STEMI without tombstoning.15
Note that ST elevation may not be acute STEMI but an old STEMI with a chronically dysfunctional myocardium (dyskinetic or aneurysmal myocardium). In fact, an old STEMI may manifest as a chronic, persistent ST elevation along with Q waves, and T waves may be inverted or upright, but not ample.14 A history of an old MI, old electrocardiograms, if available, and quick bedside echocardiography may allow the diagnosis. In the case of an old dyskinetic infarct, echocardiography shows a thin, bright (scarred), and possibly aneurysmal myocardium, whereas in acute STEMI, the myocardium is neither thin nor scarred yet. If the patient does not report a history of MI, if the T wave is ample (> 75% the size of QRS), or if the patient presents with atypical ongoing angina, presume it is acute STEMI.
EARLY REPOLARIZATION
Early repolarization is a normal variant of ST elevation that equals or exceeds 1 mm (measured at the J point). It is highly prevalent in people under age 40 and remains prevalent in middle-aged people.
Two distinct and sometimes coexistent forms of early repolarization have been described: (1) ST elevation in the anterior leads V1 to V3,16–19 and (2) ST elevation in the lateral leads (V4 to V6, I, aVL) or inferior leads.18–22 The prevalence of the first form—ie, ST elevation of 1 mm or more in any of the leads V1 through V3—is 60% to 90% in men age 45 and younger, 20% to 40% in men over age 45, and about 10% in women of any age.16 Thus, this form of early repolarization is called “normal male pattern.”
Even early repolarization that involves the lateral or inferior leads is common, with a prevalence of about 15% in people ages 30 to 40 and about 5% to 10% in those 40 to 65.20–23 It is two to four times more prevalent in men and three times more prevalent in African Americans. It is also highly prevalent in athletes younger than 25 (about 30% to 40%).22
Figure 4. Early repolarization with ST-segment elevation is seen in the inferior leads and in the anterolateral leads V2 to V6. ST elevation is most prominent in lead V4 and lead II, with a concavely upward ST morphology and a notch at the J point (arrows and left magnified image). In half of early repolarization cases, the J point is smooth but well demarcated (right magnified image). Note the slight PR depression in leads II and V5. Slight PR depression may be seen in normal individuals and corresponds to the normal atrial repolarization.Either way, early repolarization closely resembles the ST elevation of pericarditis and has the following features (Figure 4):
The ST segment is concave upward, and the J point is well demarcated and may be notched or slurred (Figure 1).
ST elevation is usually no more than 3 mm.
ST elevation may be limited to the anterior leads or, in many instances, may extend to the inferior or lateral leads. Early repolarization is very rarely limited to the limb leads, and involvement of some precordial leads is the rule.18,19 The ST segment is depressed in lead aVR in 50% of patients.18,19
Figure 5. Early repolarization with a normal variant T-wave inversion in a 33-year-old black man. The ST segment is elevated with a notched J point in leads V2 to V5The T wave is usually ample and may be more than 10 mm tallin the precordial leads in one-third of patients,17 but as opposed to the ample T wave of STEMI, it is not broad and remains smaller than the QRS complex. The ample T wave distinguishes early repolarization from pericarditis, and explains the low ST-T ratio in lead V6. In up to 10% of young black men, the T wave has a terminal inversion in leads V3 to V5, and occasionally in V1 and V2, mimicking infarction(Figure 5).24
The QRS complex tends to have prominent precordial voltage, in sharp contrast to STEMI, in which QRS shrinking occurs.3,17,22
The early repolarization pattern may be intermittent, may vary among serial electrocardiograms, may decrease with a rise in sympathetic tone, as observed during exercise, and may increase with a rise in vagal tone.18,19,25,26 Although it is usually a benign finding, the early repolarization pattern in leads other than V1 to V3 has been associated with an increased risk of sudden death, particularly when the ST elevation is horizontal-descending rather than upsloping and, possibly, when early repolarization involves the inferior leads with a J point that is notched or elevated 2 mm or more.20,22
PERICARDITIS
Figure 6. Diffuse ST-segment elevation in most leads, with ST depression in lead aVR and an isoelectric ST segment in V1. None of the STEMI features are present: ST elevation is concave upward, no reciprocal ST depression is seen except in lead aVR; the T wave is not wide, inverted, or ample (in relation to the QRS complex); and no Q wave is seen. Furthermore, ST elevation does not exceed 5 mm; ST and T heights are smaller than QRS height; and PR depression is present (circled areas). As opposed to early repolarization, the ratio of ST to T in leads V5 and V6 exceeds 25%. This is consistent with pericarditis, and the hospital course of this patient confirmed this diagnosis.In pericarditis, ST elevation is concave upward and is widespread to more than one region without reciprocal ST depression, except for the frequent ST depression in leads aVR and V1 (64%)27; ST elevation is seldom greater than 4 to 5 mm (Figure 6).27,28 Since the subepicardial injury is diffuse in pericarditis, the axis of the ST segment follows the anatomic axis of the heart and is generally +45° in the frontal plane. Thus, ST depression is seen in leads aVR and V1; ST elevation is highest in leads II, V5, and V6 and is less in leads III and aVL, where the ST segment may occasionally be depressed.29
Transient PR depression greater than 1 mm is often seen, particularly in leads II, aVF, and V4 to V6, and represents atrial subepicardial injury. PR depression in those leads is always associated with PR elevation in lead aVR and sometimes V1. PR changes often coexist with ST changes but may be isolated and may precede ST changes.30 PR depression is characteristic of pericarditis but may be seen in early repolarization, where it is less marked than in pericarditis (< 0.8 mm) and implies early repolarization of the atrial tissue,31 and in MI, where it implies atrial infarction with atrial injury pattern.
Classically, it is said that in pericarditis, unlike in STEMI, the T wave does not invert until the ST elevation subsides. In reality, up to 40% of patients develop a notched or biphasic positive-negative T wave before full return of the ST segment to the baseline.27,32 And if T-wave inversion antedates pericarditis, concomitant ST elevation and T-wave inversion may be seen once pericarditis develops. However, the T wave inverts less deeply and less completely than in STEMI, and the corrected QT interval remains normal even when the T wave inverts.
Three criteria distinguish pericarditis from early repolarization (but not from STEMI):
PR depression greater than 1 mm
ST-segment depression in lead V1
A ratio of ST-segment height to T-wave height of at least 25% in lead V6, V5, V4, or I. This feature distinguishes pericarditis from early repolarization with a high sensitivity and specificity. In pericarditis, the T waves have normal or reduced amplitude, and the ST-T ratio is therefore high,33 whereas in early repolarization the T waves are tall, so the ST-T ratio is less than 25%.
Widespread ST elevation may be seen with both pericarditis and early repolarization. ST elevation limited to the anterior leads is more likely to be early repolarization than pericarditis.
LEFT BUNDLE BRANCH BLOCK
Figure 7. Supraventricular tachycardia with a typical left bundle branch block pattern in leads I and aVL. Concordant ST-segment elevation is seen in leads I and aVL, while concordant ST depression is seen in the inferior leads (arrows). The ST elevation in lead V2 is discordant but is disproportionately high in relation to the QRS (well above 25% of the QRS height). All these features are diagnostic of STEMI.In left bundle branch block, a deep and wide S wave is seen in leads V1 to V3 and sometimes in the inferior leads, with ST elevation and T waves that are discordant with the QRS complex—ie, directed opposite to the QRS (Figures 7–9). The ST elevation is typically concave upward.8,34 Occasionally, ST elevation may be straight or convex, mimicking the dome of STEMI. In the lateral leads, the discordant ST segment is depressed, mimicking a reciprocal ST change.
The following findings imply MI:
Figure 8. Left bundle branch block with discordant ST-segment changes. However, the T wave is wide and fused with the ST segment in a domed morphology, and the T wave is larger than the QRS in leads V4, V5, and II (arrows). This implies the diagnosis of STEMI with hyperacute T waves. This patient had an occluded left anterior descending coronary artery.ST elevation or depression that is concordant with the QRS complex. Moreover, since ST deviation is mandatory with left bundle branch block, a “normal-looking” ST segment implies ischemia.
Inverted T waves concordant with the QRS in more than one lead, or biphasic T waves in more than one lead (eg, V1 to V3). Across the precordial leads, T waves may transition from positive to negative one lead earlier or later than the QRS and ST transition. Therefore, even in the absence of ischemia, the T wave may be inverted in lead V3, in which the QRS is deeply negative and the ST is still elevated (negative T-wave concordance in one lead). Also, the T wave may be upright in leads V5, V6, and I where QRS is upright and the ST segment is depressed (positive T-wave concordance does not imply ischemia).
Figure 9. Left bundle branch block with abnormal T waves. Panels A and B show discordant ST-segment elevation in V1 to V3 but concordant T wave inversion (A) or biphasic T wave (B). This is consistent with an anterior injury pattern. Panel C shows concordant T-wave inversion in the inferior leads, consistent with inferior injury. Panel D shows a large concordant T wave in lead V6, larger than the QRS, consistent with injury.In addition to concordance, a discordant ST segment or T wave that is very large may imply ischemia. For example, a discordant ST segment or T wave that is larger than the QRS height implies ischemia. A discordant ST elevation greater than 5 mm has been suggested by Sgarbossa et al35 as a diagnostic feature of STEMI; however, this feature is seen in 10% of control patients with left bundle branch block and no STEMI, and it is thus poorly specific and also poorly sensitive, frequently missing STEMI.35–37 Smith et al36 have suggested that a discordant ST elevation of at least 25% of the S-wave depth is a far more sensitive and accurate feature but one that may still be found in up to 10% of control patients.36
LEFT VENTRICULAR HYPERTROPHY
In left ventricular hypertrophy, a deep S wave is seen in leads V1 to V3, with ST elevation and T waves that are discordant with the QRS complex. Rarely, ST elevation may be straight or convex. The following findings imply MI:
ST elevation or depression that is concordant with the QRS.
Inverted T waves that are concordant with the QRS in more than one lead, or biphasic T waves in more than one lead (eg, V1 to V3).
A discordant ST segment or a T wave that is very large may imply ischemia. In left ventricular hypertrophy, ST elevation is usually less than 2.5 mm in leads V1 to V3 and is rarely seen in the inferior leads, where it would be less than 1 mm.34 When ST elevation is seen in leads V1 to V3 in left ventricular hypertrophy, an ST magnitude of 25% or more of the total QRS voltage has a 91% specificity for STEMI.34
On another note, right ventricular hypertrophy and right bundle branch block may lead to ST-segment depression and T-wave inversion, but not to ST elevation. Thus, ST elevation occurring with right ventricular hypertrophy or right bundle branch block implies STEMI. While only left bundle branch block poses a diagnostic challenge, both types of bundle branch block, if secondary to STEMI, represent equally high-risk categories.38
PREEXCITATION
Figure 10. At first glance, it seems there is ST-segment elevation in the inferior leads II, III, and aVF, with a wide Q wave. Moreover, there is a wide and tall R wave in lead V1 suggesting an associated posterior infarction. All this is consistent with acute inferoposterior STEMI. On further analysis, however, a slur is seen on the upslope of QRS in leads V1 to V6 (arrows), and the P wave is “riding” this slur. In the inferior leads, the P wave is riding the Q wave, which is in fact a negative delta wave. Thus, this electrocardiogram represents preexcitation. The ST deviations are secondary to the preexcitation and have an orientation opposite to the delta wave.Preexcitation may be associated with negative delta waves that mimic Q waves, and with ST elevation in the leads where the negative delta waves are seen, ie, ST elevation discordant with the delta wave (Figure 10). The QRS morphology and the delta wave allow preexcitation to be distinguished from STEMI.
HYPERKALEMIA
Figure 11. There are ST-segment elevations in leads V1–V4, ST-segment depressions in the inferior leads, and peaked T waves in leads V3–V5. These T waves have a narrow base and seem to “pull” the ST segment, creating ST elevation in the anterior leads and ST depression in the inferior leads (arrows). This shape is consistent with hyperkalemia. In addition, the downsloping ST elevation seen in V1 and V2 is consistent with hyperkalemia (arrowhead). Occasionally, STEMI may have a similar ST-T shape. An rSR’ pattern is seen in V1–V2; this is consistent with STEMI but also with hyperkalemia, in which conduction blocks are common. The serum potassium level was 7.4 mmol/L (normal 3.5–5), and coronary angiography revealed normal coronary arteries.The most common finding in hyperkalemia is a peaked, narrow-based T wave that is usually, but not necessarily, tall. ST elevation may be evident in leads V1 to V3 (Figure 11). In contrast with hyperkalemia, the T wave of STEMI is typically wide.
OTHER CAUSES OF ST-SEGMENT ELEVATION
Takotsubo cardiomyopathy
Takotsubo cardiomyopathy mimics all electrocardiographic features of anteroapical STEMI. ST elevation may extend to the inferior leads but cannot be isolated in the inferior leads.39 As in apical STEMI, reciprocal ST depression is uncommon. Within 24 to 48 hours, ST elevation evolves into deep anterior T-wave inversion and a prolonged QT interval. Transient Q waves may be seen.
Myocarditis
Myocarditis may have one of two electrocardiographic patterns: a pericarditis pattern, or a typical STEMI pattern with Q waves sometimes localized to one area.40
Atrial flutter waves
Figure 12. Atrial flutter that simulates ST-segment elevation. An “F” indicates the negative flutter wave; an asterisk indicates the upslope of the flutter wave that is superimposed on the ST segment, mimicking ST elevation.Atrial flutter waves, particularly of 2:1 atrial flutter, may deform the ST segment so that it mimics an injury pattern on the electrocardiogram. Flutter waves may mimic ST elevation or ST depression (Figure 12).
Large pulmonary embolism
A large pulmonary embolism may be associated with T-wave inversion in the anterior leads or the inferior leads, or both, reflective of cor pulmonale. Less commonly, ST elevation in the anterior or inferior leads is seen. In fact, changes of both anterior and inferior ischemia should always suggest a pulmonary embolism.41,42
Brugada syndrome
Figure 13. Type 1 Brugada pattern in V1 and V1, with a downsloping ST-segment elevation that creates a pseudo-R’ wave (pseudo-right bundle branch block). The QRS does not have a right bundle branch block morphology in leads V5 and V6.Brugada syndrome is characterized by ST elevation and a right bundle branch block or pseudo-right bundle branch block pattern in at least two of the leads V1 to V3. In pseudo-right bundle branch block, the QRS adopts an rSR morphology in the anterior leads but is normal in the lateral leads. Type 1 Brugada pattern, the pattern that is most specifically associated with sudden death, is characterized by a coved, downsloping ST elevation of 2 mm or more with T-wave inversion (Figure 13).43 The Brugada pattern can be transient, triggered by fever, cocaine, or class I antiarrhythmic drugs.
Hyperkalemia, Brugada syndrome, and sometimes pulmonary embolism are characterized by an ST elevation that slopes downward (Figures 11 and 13), which contrasts with the upsloping, convex ST elevation of STEMI.
References
Rautaharju PM, Surawicz B, Gettes LS, et al; American Heart Association Electrocardiography and Arrhythmias Committee, Council on Clinical Cardiology; American College of Cardiology Foundation; Heart Rhythm Society. AHA/ACCF/HRS recommendations for the standardization and interpretation of the electrocardiogram: part IV: the ST-segment, T and U waves, and the QT interval: a scientific statement from the American Heart Association Electrocardiography and Arrhythmias Committee, Council on Clinical Cardiology; the American College of Cardiology Foundation; and the Heart Rhythm Society. Endorsed by the International Society for Computerized Electrocardiology. J Am Coll Cardiol 2009; 53:982–991.
Surawicz B, Knilans TK. Chou’s Electrocardiography in Clinical Practice: Adult and Pediatric. 5th ed. Philadelphia, PA: WB Saunders; 2001:194–207.
Smith SW, Khalil A, Henry TD, et al. Electrocardiographic differentiation of early repolarization from subtle anterior ST-segment elevation myocardial infarction. Ann Emerg Med 2012; 60:45–56.e2.
American College of Emergency Physicians; Society for Cardiovascular Angiography and Interventions; O’Gara PT, Kushner FG, Ascheim DD, et al. 2013 ACCF/AHA guideline for the management of ST-elevation myocardial infarction: a report of the American College of Cardiology Foundation/American Heart Association Task Force on Practice Guidelines. J Am Coll Cardiol 2013; 61:e78–e140.
Thygesen K, Alpert JS, Jaffe AS, et al; Joint ESC/ACCF/AHA/WHF Task Force for the Universal Definition of Myocardial Infarction. Third universal definition of myocardial infarction. Circulation 2012; 126:2020–2035.
Matetzky S, Freimark D, Chouraqui P, et al. Significance of ST segment elevations in posterior chest leads (V7 to V9) in patients with acute inferior myocardial infarction: application for thrombolytic therapy. J Am Coll Cardiol 1998; 31:506–511.
Brady WJ, Perron AD, Martin ML, Beagle C, Aufderheide TP. Cause of ST-segment abnormality in ED chest pain patients. Am J Emerg Med 2001; 19:25–28.
Brady WJ, Syverud SA, Beagle C, et al. Electrocardiographic ST-segment elevation: the diagnosis of acute myocardial infarction by morphologic analysis of the ST segment. Acad Emerg Med 2001; 8:961–967.
Smith SW. Upwardly concave ST-segment morphology is common in acute left anterior descending coronary occlusion. J Emerg Med 2006; 31:69–77.
Kosuge M, Kimura K, Ishikawa T, et al. Value of ST-segment elevation pattern in predicting infarct size and left ventricular function at discharge in patients with reperfused acute anterior myocardial infarction. Am Heart J 1999; 137:522–527.
Birnbaum Y, Sclarovsky S, Mager A, Strasberg B, Rechavia E. ST segment depression in a VL: a sensitive marker for acute inferior myocardial infarction. Eur Heart J 1993; 14:4–7.
Engelen DJ, Gorgels AP, Cheriex EC, et al. Value of the electrocardiogram in localizing the occlusion site in the left anterior descending coronary artery in acute anterior myocardial infarction. J Am Coll Cardiol 1999; 34:389–395.
Collins MS, Carter JE, Dougherty JM, Majercik SM, Hodsden JE, Logue EE. Hyperacute T-wave criteria using computer ECG analysis. Ann Emerg Med 1990; 19:114–120.
Smith SW. T/QRS ratio best distinguishes ventricular aneurysm from anterior myocardial infarction. Am J Emerg Med 2005; 23:279–287.
Surawicz B, Parikh SR. Prevalence of male and female patterns of early ventricular repolarization in the normal ECG of males and females from childhood to old age. J Am Coll Cardiol 2002; 40:1870–1876.
Klatsky AL, Oehm R, Cooper RA, Udaltsova N, Armstrong MA. The early repolarization normal variant electrocardiogram: correlates and consequences. Am J Med 2003; 115:171–177.
Mehta M, Jain AC, Mehta A. Early repolarization. Clin Cardiol 1999; 22:59–65.
Mehta MC, Jain AC. Early repolarization on scalar electrocardiogram. Am J Med Sci 1995; 309:305–311.
Rollin A, Maury P, Bongard V, et al. Prevalence, prognosis, and identification of the malignant form of early repolarization pattern in a population-based study. Am J Cardiol 2012; 110:1302–1308.
Tikkanen JT, Anttonen O, Junttila MJ, et al. Long-term outcome associated with early repolarization on electrocardiography. N Engl J Med 2009; 361:2529–2537.
Tikkanen JT, Junttila MJ, Anttonen O, et al. Early repolarization: electrocardiographic phenotypes associated with favorable long-term outcome. Circulation 2011; 123:2666–2673.
Noseworthy PA, Tikkanen JT, Porthan K, et al. The early repolarization pattern in the general population: clinical correlates and heritability. J Am Coll Cardiol 2011; 57:2284–2289.
Wasserburger RH. Observations on the juvenile pattern of adult negro males. Am J Med 1955; 18:428–437.
Kralios FA, Martin L, Burgess MJ, Millar K. Local ventricular repolarization changes due to sympathetic nerve-branch stimulation. Am J Physiol 1975; 228:1621–1626.
Spratt KA, Borans SM, Michelson EL. Early repolarization: normalization of the electrocardiogram with exercise as a clinically useful diagnostic feature. J Invasive Cardiol 1995; 7:238–242.
Surawicz B, Lasseter KC. Electrocardiogram in pericarditis. Am J Cardiol 1970; 26:471–474.
Hull E. The electrocardiogram in pericarditis. Am J Cardiol 1961; 7:21–32.
Spodick DH. Diagnostic electrocardiographic sequences in acute pericarditis. Significance of PR segment and PR vector changes. Circulation 1973; 48:575–580.
Spodick DH. Acute pericarditis: current concepts and practice. JAMA 2003; 289:1150–1153.
Charles MA, Bensinger TA, Glasser SP. Atrial injury current in pericarditis. Arch Intern Med 1973; 131:657–662.
Noth PH, Barnes HR. Electrocardiographic changes associated with pericarditis. Arch Intern Med 1940; 65:291–320.
Ginzton LE, Laks MM. The differential diagnosis of acute pericarditis from the normal variant: new electrocardiographic criteria. Circulation 1982; 65:1004–1009.
Armstrong EJ, Kulkarni AR, Bhave PD, et al. Electrocardiographic criteria for ST-elevation myocardial infarction in patients with left ventricular hypertrophy. Am J Cardiol 2012; 110:977–983.
Sgarbossa EB, Pinski SL, Barbagelata A, et al. Electrocardiographic diagnosis of evolving acute myocardial infarction in the presence of left bundle-branch block. GUSTO-1 (Global Utilization of Streptokinase and Tissue Plasminogen Activator for Occluded Coronary Arteries) Investigators. N Engl J Med 1996; 334:481–487.
Smith SW, Dodd KW, Henry TD, Dvorak DM, Pearce LA. Diagnosis of ST-elevation myocardial infarction in the presence of left bundle branch block with the ST-elevation to S-wave ratio in a modified Sgarbossa rule. Ann Emerg Med 2012; 60:766–776.
Madias JE, Sinha A, Agarwal H, Ashtiani R. ST-segment elevation in leads V1-V3 in patients with LBBB. J Electrocardiol 2001; 34:87–88.
Sgarbossa EB, Pinski SL, Topol EJ, et al. Acute myocardial infarction and complete bundle branch block at hospital admission: clinical characteristics and outcome in the thrombolytic era. GUSTO-I Investigators. Global Utilization of Streptokinase and t-PA [tissue-type plasminogen activator] for Occluded Coronary Arteries. J Am Coll Cardiol 1998; 31:105–110.
Bybee KA, Kara T, Prasad A, et al. Systematic review: transient left ventricular apical ballooning: a syndrome that mimics ST-segment elevation myocardial infarction. Ann Intern Med 2004; 141:858–865.
Magnani JW, Dec GW. Myocarditis: current trends in diagnosis and treatment. Circulation 2006; 113:876–890.
Sreeram N, Cheriex EC, Smeets JL, Gorgels AP, Wellens HJ. Value of the 12-lead electrocardiogram at hospital admission in the diagnosis of pulmonary embolism. Am J Cardiol 1994; 73:298–303.
Glancy DL, Mikdadi GM. Syncope in a 67-year-old man. Proc (Bayl Univ Med Cent) 2005; 18:74–75.
Wilde AA, Antzelevitch C, Borggrefe M, et al; Study Group on the Molecular Basis of Arrhythmias of the European Society of Cardiology. Proposed diagnostic criteria for the Brugada syndrome: consensus report. Circulation 2002; 106:2514–2519.
ST, ST segment, ST segment elevation, ST elevation myocardial infarction, STEMI, early repolarization, pericarditis, left bundle branch block, hyperkalemia, Elias Hanna, David Glancy
Legacy Keywords
ST, ST segment, ST segment elevation, ST elevation myocardial infarction, STEMI, early repolarization, pericarditis, left bundle branch block, hyperkalemia, Elias Hanna, David Glancy
Features of STEMI: (1) ST elevation that is straight or convex upward and blends with T to form a dome; (2) wide upright T or inverted T waves; (3) Q waves; (4) ST elevation or T waves that may approximate or exceed QRS height; and (5) reciprocal ST depression.
Features of early repolarization include a notched J point and ST elevation not exceeding 3 mm.
Features of pericarditis include PR depression greater than 1 mm and ST elevation less than 5 mm.
Features of left bundle branch block, left ventricular hypertrophy, and preexcitation: both ST and T are discordant to QRS; ST elevation is less than 25% of QRS height (and less than 2.5 mm in left ventricular hypertrophy); and delta waves, short PR, and pseudo-Q waves are seen in preexcitation.
Features of hyperkalemia include narrow-based, peaked T waves “pulling” the ST segment.
Disallow All Ads
Alternative CME
Consolidated Pubs: Do Not Show Source Publication Logo
Syncope is a transient loss of consciousness and postural tone with spontaneous, complete recovery. There are three major types: neurally mediated, orthostatic, and cardiac (Table 1).
NEURALLY MEDIATED SYNCOPE
Neurally mediated (reflex) syncope is the most common type, accounting for two-thirds of cases.1–3 It results from autonomic reflexes that respond inappropriately, leading to vasodilation and bradycardia.
Neurally mediated syncope is usually preceded by premonitory symptoms such as lightheadedness, diaphoresis, nausea, malaise, abdominal discomfort, and tunnel vision. However, this may not be the case in one-third of patients, especially in elderly patients, who may not recognize or remember the warning symptoms. Palpitations are frequently reported with neurally mediated syncope and do not necessarily imply that the syncope is due to an arrhythmia.4,5 Neurally mediated syncope does not usually occur in the supine position4,5 but can occur in the seated position.6
Subtypes of neurally mediated syncope are as follows:
Vasovagal syncope
Vasovagal syncope is usually triggered by sudden emotional stress, prolonged sitting or standing, dehydration, or a warm environment, but it can also occur without a trigger. It is the most common type of syncope in young patients (more so in females than in males), but contrary to a common misconception, it can also occur in the elderly.7 Usually, it is not only preceded by but also followed by nausea, malaise, fatigue, and diaphoresis4,5,8; full recovery may be slow. If the syncope lasts longer than 30 to 60 seconds, clonic movements and loss of bladder control are common.9
Mechanism. Vasovagal syncope is initiated by anything that leads to strong myocardial contractions in an "empty" heart. Emotional stress, reduced venous return (from dehydration or prolonged standing), or vasodilation (caused by a hot environment) stimulates the sympathetic nervous system and reduces the left ventricular cavity size, which leads to strong hyperdynamic contractions in a relatively empty heart. This hyperdynamic cavity obliteration activates myocardial mechanoreceptors, initiating a paradoxical vagal reflex with vasodilation and relative bradycardia.10 Vasodilation is usually the predominant mechanism (vasodepressor response), particularly in older patients, but severe bradycardia is also possible (cardioinhibitory response), particularly in younger patients.7 Diuretic and vasodilator therapies increase the predisposition to vasovagal syncope, particularly in the elderly.
On tilt-table testing, vasovagal syncope is characterized by hypotension and relative bradycardia, sometimes severe (see Note on Tilt-Table Testing).10–12
Situational syncope
Situational syncope is caused by a reflex triggered in specific circumstances such as micturition, defecation, coughing, weight-lifting, laughing, or deglutition. The reflex may be initiated by a receptor on the visceral wall (eg, the bladder wall) or by straining that reduces venous return.
Carotid sinus hypersensitivity
Carotid sinus hypersensitivity is an abnormal response to carotid massage, predominantly occurring in patients over the age of 50. In spontaneous carotid sinus syndrome, syncope clearly occurs in a situation that stimulates the carotid sinus, such as head rotation, head extension, shaving, or wearing a tight collar. It is a rare cause of syncope, responsible for about 1% of cases. Conversely, induced carotid sinus syndrome is much more common and represents carotid sinus hypersensitivity in a patient with unexplained syncope and without obvious triggers; the abnormal response is mainly induced during carotid massage rather than spontaneously. In the latter case, carotid sinus hypersensitivity is a marker of a diseased sinus node or atrioventricular node that cannot withstand any inhibition. This diseased node is the true cause of syncope rather than carotid sinus hypersensitivity per se, and carotid massage is a "stress test" that unveils conduction disease.
Palpitations do not necessarily imply that syncope is due to an arrhythmia
Thus, carotid massage is indicated in cases of unexplained syncope regardless of circumstantial triggers. This test consists of applying firm pressure over each carotid bifurcation (just below the angle of the jaw) consecutively for 10 seconds. It is performed at the bedside, and may be performed with the patient in both supine and erect positions during tilt-table testing; erect positioning of the patient increases the sensitivity of this test.
An abnormal response to carotid sinus massage is defined as any of the following13–15:
Vasodepressor response: the systolic blood pressure decreases by at least 50 mm Hg
Cardioinhibitory response: sinus or atrioventricular block causes the heartbeat to pause for 3 or more seconds
Mixed vasodepressor and cardioinhibitory response.
Overall, a cardioinhibitory component is present in about two-thirds of cases of carotid sinus hypersensitivity.
Carotid sinus hypersensitivity is found in 25% to 50% of patients over age 50 who have had unexplained syncope or a fall, and it is seen almost equally in men and women.13
One study correlated carotid sinus hypersensitivity with the later occurrence of asystolic syncope during prolonged internal loop monitoring; subsequent pacemaker therapy reduced the burden of syncope.14 Another study, in patients over 50 years old with unexplained falls, found that 16% had cardioinhibitory carotid sinus hypersensitivity. Pacemaker placement reduced falls and syncope by 70% compared with no pacemaker therapy in these patients.15
On the other hand, carotid sinus hypersensitivity can be found in 39% of elderly patients who do not have a history of fainting or falling, so it is important to rule out other causes of syncope before attributing it to carotid sinus hypersensitivity.
Postexertional syncope
While syncope on exertion raises the worrisome possibility of a cardiac cause, postexertional syncope is usually a form of vasovagal syncope. When exercise ceases, venous blood stops getting pumped back to the heart by peripheral muscular contraction. Yet the heart is still exposed to the catecholamine surge induced by exercising, and it hypercontracts on an empty cavity. This triggers a vagal reflex.
Postexertional syncope may also be seen in hypertrophic obstructive cardiomyopathy or aortic stenosis, in which the small left ventricular cavity is less likely to tolerate the reduced preload after exercise and is more likely to obliterate.
ORTHOSTATIC HYPOTENSION
Orthostatic hypotension accounts for about 10% of cases of syncope.1–3
Normally, after the first few minutes of standing, about 25% to 30% of the blood pools in the veins of the pelvis and the lower extremities, strikingly reducing venous return and stroke volume. Upon more prolonged standing, more blood leaves the vascular space and collects in the extravascular space, further reducing venous return. This normally leads to a reflex increase in sympathetic tone, peripheral and splanchnic vasoconstriction, and an increase in heart rate of 10 to 15 beats per minute. Overall, cardiac output is reduced and vascular resistance is increased while blood pressure is maintained, blood pressure being equal to cardiac output times vascular resistance.
Vasovagal syncope is initiated by anything that leads to strong contractions in an 'empty' heart
Orthostatic hypotension is characterized by autonomic failure, with a lack of compensatory increase in vascular resistance or heart rate upon orthostasis, or by significant hypovolemia that cannot be overcome by sympathetic mechanisms. It is defined as a drop in systolic blood pressure of 20 mm Hg or more or a drop in diastolic pressure of 10 mm Hg or more after 30 seconds to 5 minutes of upright posture. Blood pressure is checked immediately upon standing and at 3 and 5 minutes. This may be done at the bedside or during tilt-table testing.2,4
Some patients have an immediate drop in blood pressure of more than 40 mm Hg upon standing, with a quick return to normal within 30 seconds. This "initial orthostatic hypotension" may be common in elderly patients taking antihypertensive drugs and may elude detection during standard blood pressure measurement.2 Other patients with milder orthostatic hypotension may develop a more delayed hypotension 10 to 15 minutes later, as more blood pools in the periphery.16
Along with the drop in blood pressure, a failure of the heart rate to increase identifies autonomic dysfunction. On the other hand, an increase in the heart rate of more than 20 to 30 beats per minute may signify a hypovolemic state even if blood pressure is maintained, the lack of blood pressure drop being related to the excessive heart rate increase.
Orthostatic hypotension is the most common cause of syncope in the elderly and may be due to autonomic dysfunction (related to age, diabetes, uremia, or Parkinson disease), volume depletion, or drugs that block autonomic effects or cause hypovolemia, such as vasodilators, beta-blockers, diuretics, neuropsychiatric medications, and alcohol.
Since digestion leads to peripheral vasodilation and splanchnic blood pooling, syncope that occurs within 1 hour after eating has a mechanism similar to that of orthostatic syncope.
Supine hypertension with orthostatic hypotension. Some patients with severe autonomic dysfunction and the inability to regulate vascular tone have severe hypertension when supine and significant hypotension when upright.
Postural orthostatic tachycardia syndrome, another form of orthostatic failure, occurs most frequently in young women (under the age of 50). In this syndrome, autonomic dysfunction affects peripheral vascular resistance, which fails to increase in response to orthostatic stress. This autonomic dysfunction does not affect the heart, which manifests a striking compensatory increase in rate of more than 30 beats per minute within the first 10 minutes of orthostasis, or an absolute heart rate greater than 120 beats per minute. Unlike in orthostatic hypotension, blood pressure and cardiac output are maintained through this increase in heart rate, although the patient still develops symptoms of severe fatigue or near-syncope, possibly because of flow maldistribution and reduced cerebral flow.2
While postural orthostatic tachycardia syndrome per se does not induce syncope,2 it may be associated with a vasovagal form of syncope that occurs beyond the first 10 minutes of orthostasis in up to 38% of these patients.17
In a less common, hyperadrenergic form of postural orthostatic tachycardia syndrome, there is no autonomic failure but the sympathetic system is overly activated, with orthostasis leading to excessive tachycardia.10,18
CARDIAC SYNCOPE
Accounting for 10% to 20% of cases of syncope, a cardiac cause is the main concern in patients presenting with syncope, as cardiac syncope predicts an increased risk of death and may herald sudden cardiac death.1,2,8,19,20 It often occurs suddenly without any warning signs, in which case it is called malignant syncope. Unlike what occurs in neurally mediated syncope, the postrecovery period is not usually marked by lingering malaise.
There are three forms of cardiac syncope:
Syncope due to structural heart disease with cardiac obstruction
In cases of aortic stenosis, hypertrophic obstructive cardiomyopathy, or severe pulmonary arterial hypertension, peripheral vasodilation occurs during exercise, but cardiac output cannot increase because of the fixed or dynamic obstruction to the ventricular outflow. Since blood pressure is equal to cardiac output times peripheral vascular resistance, pressure drops with the reduction in peripheral vascular resistance. Exertional ventricular arrhythmias may also occur in these patients. Conversely, postexertional syncope is usually benign.
Syncope due to ventricular tachycardia
Ventricular tachycardia can be secondary to underlying structural heart disease, with or without reduced ejection fraction, such as coronary arterial disease, hypertrophic cardiomyopathy, hypertensive cardiomyopathy, or valvular disease. It can also be secondary to primary electrical disease (eg, long QT syndrome, Wolff-Parkinson-White syndrome, Brugada syndrome, arrhythmogenic right ventricular dysplasia, sarcoidosis).
Occasionally, fast supraventricular tachycardia causes syncope at its onset, before vascular compensation develops. This occurs in patients with underlying heart disease.2,8,19
Syncope from bradyarrhythmias
Bradyarrhythmias can occur with or without underlying structural heart disease. They are most often related to degeneration of the conduction system or to medications rather than to cardiomyopathy.
Caveats
When a patient with a history of heart failure presents with syncope, the top considerations are ventricular tachycardia and bradyarrhythmia. Nevertheless, about half of cases of syncope in patients with cardiac disease have a noncardiac cause,19 including the hypotensive or bradycardiac side effect of drugs.
As noted above, most cases of syncope are neurally mediated. However, long asystolic pauses due to sinus or atrioventricular nodal block are the most frequent mechanism of unexplained syncope and are seen in more than 50% of syncope cases on prolonged rhythm monitoring.1,21 These pauses may be related to intrinsic sinus or atrioventricular nodal disease or, more commonly, to extrinsic effects such as the vasovagal mechanism. Some experts favor classifying and treating syncope on the basis of the final mechanism rather than the initiating process, but this is not universally accepted.1,22
OTHER CAUSES OF SYNCOPE
Acute medical or cardiovascular illnesses can cause syncope and are looked for in the appropriate clinical context: severe hypovolemia or gastrointestinal bleeding, large pulmonary embolus with hemodynamic compromise, tamponade, aortic dissection, or hypoglycemia.
Bilateral critical carotid disease or severe vertebrobasilar disease very rarely cause syncope, and, when they do, they are associated with focal neurologic deficits.2 Vertebrobasilar disease may cause "drop attacks," ie, a loss of muscular tone with falling but without loss of consciousness.23
Severe proximal subclavian disease leads to reversal of the flow in the ipsilateral vertebral artery as blood is shunted toward the upper extremity. It manifests as dizziness and syncope during the ipsilateral upper extremity activity, usually with focal neurologic signs (subclavian steal syndrome).2
Psychogenic pseudosyncope is characterized by frequent attacks that typically last longer than true syncope and occur multiple times per day or week, sometimes with a loss of motor tone.2 It occurs in patients with anxiety or somatization disorders.
SEIZURE: A SYNCOPE MIMIC
Certain features differentiate seizure from syncope:
In seizure, unconsciousness often lasts longer than 5 minutes
After a seizure, the patient may experience postictal confusion or paralysis
Seizure may include prolonged tonic-clonic movements; although these movements may be seen with any form of syncope lasting more than 30 seconds, the movements during syncope are more limited and brief, lasting less than 15 seconds
Tongue biting strongly suggests seizure.
Urinary incontinence does not help distinguish the two, as it frequently occurs with syncope as well as seizure.
DIAGNOSTIC EVALUATION OF SYNCOPE
Table 2 lists clinical clues to the type of syncope.2–5,8
Underlying structural heart disease is the most important predictor of ventricular arrhythmia and death.20,24–26 Thus, the primary goal of the evaluation is to rule out structural heart disease by history, examination, electrocardiography, and echocardiography (Figure 1).
Initial strategy for finding the cause
Figure 1. Management of syncope.
The cause of syncope is diagnosed by history and physical examination alone in up to 50% of cases, mainly neurally mediated syncope, orthostatic syncope, or seizure.2,3,19
Always check blood pressure with the patient both standing and sitting and in both arms, and obtain an electrocardiogram.
Perform carotid massage in all patients over age 50 if syncope is not clearly vasovagal or orthostatic and if cardiac syncope is not likely. Carotid massage is contraindicated if the patient has a carotid bruit or a history of stroke.
Electrocardiography establishes or suggests a diagnosis in 10% of patients (Table 3, Figure 2).1,2,8,19 A normal electrocardiogram or a mild nonspecific ST-T abnormality suggests a low likelihood of cardiac syncope and is associated with an excellent prognosis. Abnormal electrocardiographic findings are seen in 90% of cases of cardiac syncope and in only 6% of cases of neurally mediated syncope.27 In one study of syncope patients with normal electrocardiograms and negative cardiac histories, none had an abnormal echocardiogram.28
If the heart is normal
If the history suggests neurally mediated syncope or orthostatic hypotension and the history, examination, and electrocardiogram do not suggest coronary artery disease or any other cardiac disease, the workup is stopped.
If the patient has signs or symptoms of heart disease
If the patient has signs or symptoms of heart disease (angina, exertional syncope, dyspnea, clinical signs of heart failure, murmur), a history of heart disease, or exertional, supine, or malignant features, heart disease should be looked for and the following performed:
Echocardiography to assess left ventricular function, severe valvular disease, and left ventricular hypertrophy
A stress test (possibly) in cases of exertional syncope or associated angina; however, the overall yield of stress testing in syncope is low (< 5%).29
If electrocardiography and echocardiography do not suggest heart disease
Figure 2. Second-degree Mobitz II atrioventricular block, with 3:2 block alternating with 2:1 block (arrows point to P waves). As seen in lead V1, right bundle branch block alternates with left bundle branch block. Beside Mobitz II block, the alternation of right and left bundle branch block indicates infranodal atrioventricular block. In fact, QRS is dropped when both bundles simultaneously block in a patient with underlying right bundle branch block, left bundle branch block, or alternating right and left bundle branch block. RBBB = right bundle branch block; LBBB = left bundle branch block
Often, in this situation, the workup can be stopped and syncope can be considered neurally mediated. The likelihood of cardiac syncope is very low in patients with normal findings on electrocardiography and echocardiography, and several studies have shown that patients with syncope who have no structural heart disease have normal long-term survival rates.20,26,30
The following workup may, however, be ordered if the presentation is atypical and syncope is malignant, recurrent, or associated with physical injury, or occurs in the supine position19:
Carotid sinus massage in patients over age 50, if not already performed. Up to 50% of these patients with unexplained syncope have carotid sinus hypersensitivity.13
24-hour Holter monitoring rarely detects significant arrhythmias, but if syncope or dizziness occurs without any arrhythmia, Holter monitoring rules out arrhythmia as the cause of the symptoms.31 The diagnostic yield of Holter monitoring is low (1% to 2%) in patients with infrequent symptoms1,2 and is not improved with 72-hour monitoring.30 The yield is higher in patients with very frequent daily symptoms, many of whom have psychogenic pseudosyncope.2
Tilt-table testing to diagnose vasovagal syncope. This test is positive for a vasovagal response in up to 66% of patients with unexplained syncope.1,19 Patients with heart disease taking vasodilators or beta-blockers may have abnormal baroreflexes. Therefore, a positive tilt test is less specific in these patients and does not necessarily indicate vasovagal syncope.
Event monitoring. If the etiology remains unclear or there are some concerns about arrhythmia, an event monitor (4 weeks of external rhythm monitoring) or an implantable loop recorder (implanted subcutaneously in the prepectoral area for 1 to 2 years) is placed. These monitors record the rhythm when the rate is lower or higher than predefined cutoffs or when the rhythm is irregular, regardless of symptoms. The patient or an observer can also activate the event monitor during or after an event, which freezes the recording of the 2 to 5 minutes preceding the activation and the 1 minute after it.
In a patient who has had syncope, a pacemaker is indicated for episodes of high-grade atrioventricular block, pauses longer than 3 seconds while awake, or bradycardia (< 40 beats per minute) while awake, and an implantable cardioverter-defibrillator is indicated for sustained ventricular tachycardia, even if syncope does not occur concomitantly with these findings. The finding of nonsustained ventricular tachycardia on monitoring increases the suspicion of ventricular tachycardia as the cause of syncope but does not prove it, nor does it necessarily dictate implantation of a cardioverter-defibrillator device.
An electrophysiologic study has a low yield in patients with normal electrocardiographic and echocardiographic studies. Bradycardia is detected in 10%.31
If heart disease or a rhythm abnormality is found
If heart disease is diagnosed by echocardiography or if significant electrocardiographic abnormalities are found, perform the following:
Pacemaker placement for the following electrocardiographic abnormalities1,2,19:
Second-degree Mobitz II or third-degree atrioventricular block
Sinus pause (> 3 seconds) or bradycardia (< 40 beats per minute) while awake
Alternating left bundle branch block and right bundle branch block on the same electrocardiogram or separate ones.
Telemetric monitoring (inpatient).
An electrophysiologic study is valuable mainly for patients with structural heart disease, including an ejection fraction 36% to 49%, coronary artery disease, or left ventricular hypertrophy with a normal ejection fraction.32 Overall, in patients with structural heart disease and unexplained syncope, the yield is 55% (inducible ventricular tachycardia in 21%, abnormal indices of bradycardia in 34%).31
However, the yield of electrophysiologic testing is low in bradyarrhythmia and in patients with an ejection fraction of 35% or less.33 In the latter case, the syncope is often arrhythmia-related and the patient often has an indication for an implantable cardioverter-defibrillator regardless of electrophysiologic study results, especially if the low ejection fraction has persisted despite medical therapy.32
If the electrophysiologic study is negative
If the electrophysiologic study is negative, the differential diagnosis still includes arrhythmia, as the yield of electrophysiologic study is low for bradyarrhythmias and some ventricular tachycardias, and the differential diagnosis also includes, at this point, neurally mediated syncope.
The next step may be either prolonged rhythm monitoring or tilt-table testing. An event monitor or an implantable loop recorder can be placed for prolonged monitoring. The yield of the 30-day event monitor is highest in patients with frequently recurring syncope, in whom it reaches a yield of up to 40% (10% to 20% will have a positive diagnosis of arrhythmia, while 15% to 20% will have symptoms with a normal rhythm).31,34 The implantable recorder has a high overall diagnostic yield and is used in patients with infrequent syncopal episodes (yield up to 50%).1,35,36
In brief, there are two diagnostic approaches to unexplained syncope: the monitoring approach (loop recorder) and the testing approach (tilt-table testing). A combination of both strategies is frequently required in patients with unexplained syncope, and, according to some investigators, a loop recorder may be implanted early on.21
Heart disease with left ventricular dysfunction and low ejection fraction
Carotid massage is indicated in cases of unexplained syncope regardless of circumstantial triggers
In patients with heart disease with left ventricular dysfunction and an ejection fraction of 35% or less, an implantable cardioverter-defibrillator can be placed without the need for an electrophysiologic study. These patients need these devices anyway to prevent sudden death, even if the cause of syncope is not an arrhythmia. Patients with a low ejection fraction and a history of syncope are at a high risk of sudden cardiac death.32 Yet in some patients with newly diagnosed cardiomyopathy, left ventricular function may improve with medical therapy. Because the arrhythmic risk is essentially high during the period of ventricular dysfunction, a wearable external defibrillator may be placed while the decision about an implantable defibrillator is finalized within the ensuing months.
In patients with hypertrophic cardiomyopathy, place an implantable cardioverter-defibrillator after any unexplained syncopal episode.
Valvular heart disease needs surgical correction.
If ischemic heart disease is suspected, coronary angiography is indicated, with revascularization if appropriate. An implantable cardioverter-defibrillator should be placed if the ejection fraction is lower than 35%. Except in a large acute myocardial infarction, the substrate for ventricular tachycardia is not ameliorated with revascularization.32,37 Consider an electrophysiologic study when syncope occurs with coronary artery disease and a higher ejection fraction.
A note on left or right bundle branch block
Patients with left or right bundle branch block and unexplained syncope (not clearly vasovagal or orthostatic) likely have syncope related to intermittent high-grade atrioventricular block.38
One study monitored these patients with an implanted loop recorder and showed that about 40% had a recurrence of syncope within 48 days, often concomitantly with complete atrioventricular block. About 55% of these patients had a major event (syncope or high-grade atrioventricular block).39 Many of the patients had had a positive tilt test; thus, tilt testing is not specific for vasovagal syncope in these patients and should not be used to exclude a bradyarrhythmic syncope. Also, patients selected for this study had undergone carotid sinus massage and an electrophysiology study with a negative result.
Underlying structural heart disease is the most important predictor of ventricular arrhythmia and death
In another analysis, an electrophysiologic study detected a proportion of the bradyarrhythmias but, more importantly, it induced ventricular tachycardia in 14% of patients with right or left bundle branch block. Although it is not sensitive enough for bradyarrhythmia, electrophysiologic study was highly specific and fairly sensitive for the occurrence of ventricular tachycardia on follow-up.38 Thus, unexplained syncope in a patient with right or left bundle branch block may warrant carotid sinus massage, then an electrophysiologic study to rule out ventricular tachycardia, followed by placement of a dual-chamber pacemaker if the study is negative for ventricular tachycardia, or at least placement of a loop recorder.
INDICATIONS FOR HOSPITALIZATION
Patients should be hospitalized if they have severe hypovolemia or bleeding, or if there is any suspicion of heart disease by history, examination, or electrocardiography, including:
History of heart failure, low ejection fraction, or coronary artery disease
An electrocardiogram suggestive of arrhythmia (Table 3)
Family history of sudden death
Lack of prodromes; occurrence of physical injury, exertional syncope, syncope in a supine position, or syncope associated with dyspnea or chest pain.2,40
In these situations, there is concern about arrhythmia, structural heart disease, or acute myocardial ischemia. The patient is admitted for immediate telemetric monitoring. Echocardiography and sometimes stress testing are performed. The patient is discharged if this initial workup does not suggest underlying heart disease. Alternatively, an electrophysiologic study is performed or a device is placed in patients found to have structural heart disease. Prolonged rhythm monitoring or tilt-table testing may be performed when syncope with underlying heart disease or worrisome features remains unexplained.
Several Web-based interactive algorithms have been used to determine the indication for hospitalization. They incorporate the above clinical, electrocardiographic, and sometimes echocardiographic features.2,24,25,40–42 A cardiology consultation is usually necessary in patients with the above features, as they frequently require specialized cardiac testing.
Among high-risk patients, the risk of sudden death, a major cardiovascular event, or significant arrhythmia is high in the first few days after the index syncopal episode, justifying the hospitalization and inpatient rhythm monitoring and workup in the presence of the above criteria.24,40,42
SYNCOPE AND DRIVING
A study has shown that the most common cause of syncope while driving is vasovagal syncope.6 In all patients, the risk of another episode of syncope was relatively higher during the first 6 months after the event, with a 12% recurrence rate during this period. However, recurrences were often also seen more than 6 months later (12% recurrence between 6 months and the following few years).6 Fortunately, those episodes rarely occurred while the patient was driving. In a study in survivors of ventricular arrhythmia, the risk of recurrence of arrhythmic events was highest during the first 6 to 12 months after the event.43
Thus, in general, patients with syncope should be prohibited from driving for at least the period of time (eg, 6 months) during which the risk of a recurrent episode of syncope is highest and during which serious cardiac disease or arrhythmia, if present, would emerge. Recurrence of syncope is more likely and more dangerous for commercial drivers who spend a significant proportion of their time driving; individualized decisions are made in these cases.
References
Brignole M, Hamdan MH. New concepts in the assessment of syncope. J Am Coll Cardiol 2012; 59:1583–1591.
Task Force for the Diagnosis and Management of Syncope; European Society of Cardiology (ESC); European Heart Rhythm Association (EHRA); Heart Failure Association (HFA); Heart Rhythm Society (HRS); Moya A, Sutton R, Ammirati F, et al. Guidelines for the diagnosis and management of syncope (version 2009 Eur Heart J 2009; 30:2631–2671.
Kapoor WN. Syncope. N Engl J Med 2000; 343:1856–1862.
Graham LA, Kenny RA. Clinical characteristics of patients with vasovagal reactions presenting as unexplained syncope. Europace 2001; 3:141–146.
Calkins H, Shyr Y, Frumin H, Schork A, Morady F. The value of the clinical history in the differentiation of syncope due to ventricular tachycardia, atrioventricular block, and neurocardiogenic syncope. Am J Med 1995; 98:365–373.
Sorajja D, Nesbitt GC, Hodge DO, et al. Syncope while driving: clinical characteristics, causes, and prognosis. Circulation 2009; 120:928–934.
Kochiadakis GE, Papadimitriou EA, Marketou ME, Chrysostomakis SI, Simantirakis EN, Vardas PE. Autonomic nervous system changes in vasovagal syncope: is there any difference between young and older patients? Pacing Clin Electrophysiol 2004; 27:1371–1377.
Alboni P, Brignole M, Menozzi C, et al. Diagnostic value of history in patients with syncope with or without heart disease. J Am Coll Cardiol 2001; 37:1921–1928.
Brignole M, Alboni P, Benditt D, et al; Task Force on Syncope; European Society of Cardiology. Task force on syncope, European Society of Cardiology. Part 1. The initial evaluation of patients with syncope. Europace 2001; 3:253–260.
Grubb BP. Neurocardiogenic syncope and related disorders of orthostatic intolerance. Circulation 2005; 111:2997–3006.
Brignole M, Menozzi C, Del Rosso A, et al. New classification of haemodynamics of vasovagal syncope: beyond the VASIS classification. Analysis of the pre-syncopal phase of the tilt test without and with nitroglycerin challenge. Vasovagal Syncope International Study. Europace 2000; 2:66–76.
Grubb BP, Kosinski D. Tilt table testing: concepts and limitations. Pacing Clin Electrophysiol 1997; 20:781–787.
Brignole M, Menozzi C, Gianfranchi L, Oddone D, Lolli G, Bertulla A. Carotid sinus massage, eyeball compression, and head-up tilt test in patients with syncope of uncertain origin and in healthy control subjects. Am Heart J 1991; 122:1644–1651.
Maggi R, Menozzi C, Brignole M, et al. Cardioinhibitory carotid sinus hypersensitivity predicts an asystolic mechanism of spontaneous neurally mediated syncope. Europace 2007; 9:563–567.
Kenny RA, Richardson DA, Steen N, Bexton RS, Shaw FE, Bond J. Carotid sinus syndrome: a modifiable risk factor for nonaccidental falls in older adults (SAFE PACE). J Am Coll Cardiol 2001; 38:1491–1496.
Gibbons CH, Freeman R. Delayed orthostatic hypotension: a frequent cause of orthostatic intolerance. Neurology 2006; 67:28–32.
Ojha A, McNeeley K, Heller E, Alshekhlee A, Chelimsky G, Chelimsky TC. Orthostatic syndromes differ in syncope frequency. Am J Med 2010; 123:245–249.
Kanjwal Y, Kosinski D, Grubb BP. The postural orthostatic tachycardia syndrome: definitions, diagnosis, and management. Pacing Clin Electrophysiol 2003; 26:1747–1757.
Brignole M, Alboni P, Benditt D, et al; Task Force on Syncope; European Society of Cardiology. Guidelines on management (diagnosis and treatment) of syncope. Eur Heart J 2001; 22:1256–1306.
Soteriades ES, Evans JC, Larson MG, et al. Incidence and prognosis of syncope. N Engl J Med 2002; 347:878–885.
Brignole M, Sutton R, Menozzi C, et al; International Study on Syncope of Uncertain Etiology 2 (ISSUE 2) Group. Early application of an implantable loop recorder allows effective specific therapy in patients with recurrent suspected neurally mediated syncope. Eur Heart J 2006; 27:1085–1092.
Brignole M, Menozzi C, Moya A, et al; International Study on Syncope of Uncertain Etiology 3 (ISSUE-3) Investigators. Pacemaker therapy in patients with neurally mediated syncope and documented asystole: Third International Study on Syncope of Uncertain Etiology (ISSUE-3): a randomized trial. Circulation 2012; 125:2566–2571.
Kubak MJ, Millikan CH. Diagnosis, pathogenesis, and treatment of "drop attacks." Arch Neurol 1964; 11:107–113.
Quinn J, McDermott D, Stiell I, Kohn M, Wells G. Prospective validation of the San Francisco Syncope Rule to predict patients with serious outcomes. Ann Emerg Med 2006; 47:448–454.
Colivicchi F, Ammirati F, Melina D, Guido V, Imperoli G, Santini M; OESIL (Osservatorio Epidemiologico sulla Sincope nel Lazio) Study Investigators. Development and prospective validation of a risk stratification system for patients with syncope in the emergency department: the OESIL risk score. Eur Heart J 2003; 24:811–819.
Kapoor WN, Hanusa BH. Is syncope a risk factor for poor outcomes? Comparison of patients with and without syncope. Am J Med 1996; 100:646–655.
Sarasin FP, Louis-Simonet M, Carballo D, et al. Prospective evaluation of patients with syncope: a population-based study. Am J Med 2001; 111:177–184.
Sarasin FP, Junod AF, Carballo D, Slama S, Unger PF, Louis-Simonet M. Role of echocardiography in the evaluation of syncope: a prospective study. Heart 2002; 88:363–367.
AlJaroudi WA, Alraies MC, Wazni O, Cerqueira MD, Jaber WA. Yield and diagnostic value of stress myocardial perfusion imaging in patients without known coronary artery disease presenting with syncope. Circ Cardiovasc Imaging 2013; 6:384–391.
Ungar A, Del Rosso A, Giada F, et al; Evaluation of Guidelines in Syncope Study 2 Group. Early and late outcome of treated patients referred for syncope to emergency department: the EGSYS 2 follow-up study. Eur Heart J 2010; 31:2021–2026.
Linzer M, Yang EH, Estes NA 3rd, Wang P, Vorperian VR, Kapoor WN. Diagnosing syncope. Part 2: Unexplained syncope. Clinical Efficacy Assessment Project of the American College of Physicians. Ann Intern Med 1997; 127:76–86.
Strickberger SA, Benson DW, Biaggioni I, et al; American Heart Association Councils on Clinical Cardiology, Cardiovascular Nursing, Cardiovascular Disease in the Young, and Stroke; Quality of Care and Outcomes Research Interdisciplinary Working Group; American College of Cardiology Foundation; Heart Rhythm Society. AHA/ACCF scientific statement on the evaluation of syncope: from the American Heart Association Councils on Clinical Cardiology, Cardiovascular Nursing, Cardiovascular Disease in the Young, and Stroke, and the Quality of Care and Outcomes Research Interdisciplinary Working Group; and the American College of Cardiology Foundation In Collaboration With the Heart Rhythm Society. J Am Coll Cardiol 2006; 47:473–484.
Fujimura O, Yee R, Klein GJ, Sharma AD, Boahene KA. The diagnostic sensitivity of electrophysiologic testing in patients with syncope caused by transient bradycardia. N Engl J Med 1989; 321:1703–1707.
Linzer M, Pritchett EL, Pontinen M, McCarthy E, Divine GW. Incremental diagnostic yield of loop electrocardiographic recorders in unexplained syncope. Am J Cardiol 1990; 66:214–219.
Edvardsson N, Frykman V, van Mechelen R, et al; PICTURE Study Investigators. Use of an implantable loop recorder to increase the diagnostic yield in unexplained syncope: results from the PICTURE registry. Europace 2011; 13:262–269.
Brignole M, Sutton R, Menozzi C, et al; International Study on Syncope of Uncertain Etiology 2 (ISSUE 2) Group. Early application of an implantable loop recorder allows effective specific therapy in patients with recurrent suspected neurally mediated syncope. Eur Heart J 2006; 27:1085–1092.
Brugada J, Aguinaga L, Mont L, Betriu A, Mulet J, Sanz G. Coronary artery revascularization in patients with sustained ventricular arrhythmias in the chronic phase of a myocardial infarction: effects on the electrophysiologic substrate and outcome. J Am Coll Cardiol 2001; 37:529–533.
Moya A, García-Civera R, Croci F, et al; Bradycardia detection in Bundle Branch Block (B4) study. Diagnosis, management, and outcomes of patients with syncope and bundle branch block. Eur Heart J 2011; 32:1535–1541.
Brignole M, Menozzi C, Moya A, et al; International Study on Syncope of Uncertain Etiology (ISSUE) Investigators. Mechanism of syncope in patients with bundle branch block and negative electrophysiological test. Circulation 2001; 104:2045–2050.
Brignole M, Shen WK. Syncope management from emergency department to hospital. J Am Coll Cardiol 2008; 51:284–287.
Daccarett M, Jetter TL, Wasmund SL, Brignole M, Hamdan MH. Syncope in the emergency department: comparison of standardized admission criteria with clinical practice. Europace 2011; 13:1632–1638.
Costantino G, Perego F, Dipaola F, et al; STePS Investigators. Short- and long-term prognosis of syncope, risk factors, and role of hospital admission: results from the STePS (Short-Term Prognosis of Syncope) study. J Am Coll Cardiol 2008; 51:276–283.
Larsen GC, Stupey MR, Walance CG, et al. Recurrent cardiac events in survivors of ventricular fibrillation or tachycardia. Implications for driving restrictions. JAMA 1994; 271:1335–1339.
Elias B. Hanna, MD Assistant Professor of Medicine, Department of Medicine, Cardiovascular Section, Louisiana State University, New Orleans
Address: Elias B. Hanna, MD, Department of Medicine, Cardiovascular Section, Louisiana State University, 1542 Tulane Avenue, Room 323, New Orleans, LA, 70112; e-mail: ehanna@lsuhsc.edu
Author and Disclosure Information
Elias B. Hanna, MD Assistant Professor of Medicine, Department of Medicine, Cardiovascular Section, Louisiana State University, New Orleans
Address: Elias B. Hanna, MD, Department of Medicine, Cardiovascular Section, Louisiana State University, 1542 Tulane Avenue, Room 323, New Orleans, LA, 70112; e-mail: ehanna@lsuhsc.edu
Syncope is a transient loss of consciousness and postural tone with spontaneous, complete recovery. There are three major types: neurally mediated, orthostatic, and cardiac (Table 1).
NEURALLY MEDIATED SYNCOPE
Neurally mediated (reflex) syncope is the most common type, accounting for two-thirds of cases.1–3 It results from autonomic reflexes that respond inappropriately, leading to vasodilation and bradycardia.
Neurally mediated syncope is usually preceded by premonitory symptoms such as lightheadedness, diaphoresis, nausea, malaise, abdominal discomfort, and tunnel vision. However, this may not be the case in one-third of patients, especially in elderly patients, who may not recognize or remember the warning symptoms. Palpitations are frequently reported with neurally mediated syncope and do not necessarily imply that the syncope is due to an arrhythmia.4,5 Neurally mediated syncope does not usually occur in the supine position4,5 but can occur in the seated position.6
Subtypes of neurally mediated syncope are as follows:
Vasovagal syncope
Vasovagal syncope is usually triggered by sudden emotional stress, prolonged sitting or standing, dehydration, or a warm environment, but it can also occur without a trigger. It is the most common type of syncope in young patients (more so in females than in males), but contrary to a common misconception, it can also occur in the elderly.7 Usually, it is not only preceded by but also followed by nausea, malaise, fatigue, and diaphoresis4,5,8; full recovery may be slow. If the syncope lasts longer than 30 to 60 seconds, clonic movements and loss of bladder control are common.9
Mechanism. Vasovagal syncope is initiated by anything that leads to strong myocardial contractions in an "empty" heart. Emotional stress, reduced venous return (from dehydration or prolonged standing), or vasodilation (caused by a hot environment) stimulates the sympathetic nervous system and reduces the left ventricular cavity size, which leads to strong hyperdynamic contractions in a relatively empty heart. This hyperdynamic cavity obliteration activates myocardial mechanoreceptors, initiating a paradoxical vagal reflex with vasodilation and relative bradycardia.10 Vasodilation is usually the predominant mechanism (vasodepressor response), particularly in older patients, but severe bradycardia is also possible (cardioinhibitory response), particularly in younger patients.7 Diuretic and vasodilator therapies increase the predisposition to vasovagal syncope, particularly in the elderly.
On tilt-table testing, vasovagal syncope is characterized by hypotension and relative bradycardia, sometimes severe (see Note on Tilt-Table Testing).10–12
Situational syncope
Situational syncope is caused by a reflex triggered in specific circumstances such as micturition, defecation, coughing, weight-lifting, laughing, or deglutition. The reflex may be initiated by a receptor on the visceral wall (eg, the bladder wall) or by straining that reduces venous return.
Carotid sinus hypersensitivity
Carotid sinus hypersensitivity is an abnormal response to carotid massage, predominantly occurring in patients over the age of 50. In spontaneous carotid sinus syndrome, syncope clearly occurs in a situation that stimulates the carotid sinus, such as head rotation, head extension, shaving, or wearing a tight collar. It is a rare cause of syncope, responsible for about 1% of cases. Conversely, induced carotid sinus syndrome is much more common and represents carotid sinus hypersensitivity in a patient with unexplained syncope and without obvious triggers; the abnormal response is mainly induced during carotid massage rather than spontaneously. In the latter case, carotid sinus hypersensitivity is a marker of a diseased sinus node or atrioventricular node that cannot withstand any inhibition. This diseased node is the true cause of syncope rather than carotid sinus hypersensitivity per se, and carotid massage is a "stress test" that unveils conduction disease.
Palpitations do not necessarily imply that syncope is due to an arrhythmia
Thus, carotid massage is indicated in cases of unexplained syncope regardless of circumstantial triggers. This test consists of applying firm pressure over each carotid bifurcation (just below the angle of the jaw) consecutively for 10 seconds. It is performed at the bedside, and may be performed with the patient in both supine and erect positions during tilt-table testing; erect positioning of the patient increases the sensitivity of this test.
An abnormal response to carotid sinus massage is defined as any of the following13–15:
Vasodepressor response: the systolic blood pressure decreases by at least 50 mm Hg
Cardioinhibitory response: sinus or atrioventricular block causes the heartbeat to pause for 3 or more seconds
Mixed vasodepressor and cardioinhibitory response.
Overall, a cardioinhibitory component is present in about two-thirds of cases of carotid sinus hypersensitivity.
Carotid sinus hypersensitivity is found in 25% to 50% of patients over age 50 who have had unexplained syncope or a fall, and it is seen almost equally in men and women.13
One study correlated carotid sinus hypersensitivity with the later occurrence of asystolic syncope during prolonged internal loop monitoring; subsequent pacemaker therapy reduced the burden of syncope.14 Another study, in patients over 50 years old with unexplained falls, found that 16% had cardioinhibitory carotid sinus hypersensitivity. Pacemaker placement reduced falls and syncope by 70% compared with no pacemaker therapy in these patients.15
On the other hand, carotid sinus hypersensitivity can be found in 39% of elderly patients who do not have a history of fainting or falling, so it is important to rule out other causes of syncope before attributing it to carotid sinus hypersensitivity.
Postexertional syncope
While syncope on exertion raises the worrisome possibility of a cardiac cause, postexertional syncope is usually a form of vasovagal syncope. When exercise ceases, venous blood stops getting pumped back to the heart by peripheral muscular contraction. Yet the heart is still exposed to the catecholamine surge induced by exercising, and it hypercontracts on an empty cavity. This triggers a vagal reflex.
Postexertional syncope may also be seen in hypertrophic obstructive cardiomyopathy or aortic stenosis, in which the small left ventricular cavity is less likely to tolerate the reduced preload after exercise and is more likely to obliterate.
ORTHOSTATIC HYPOTENSION
Orthostatic hypotension accounts for about 10% of cases of syncope.1–3
Normally, after the first few minutes of standing, about 25% to 30% of the blood pools in the veins of the pelvis and the lower extremities, strikingly reducing venous return and stroke volume. Upon more prolonged standing, more blood leaves the vascular space and collects in the extravascular space, further reducing venous return. This normally leads to a reflex increase in sympathetic tone, peripheral and splanchnic vasoconstriction, and an increase in heart rate of 10 to 15 beats per minute. Overall, cardiac output is reduced and vascular resistance is increased while blood pressure is maintained, blood pressure being equal to cardiac output times vascular resistance.
Vasovagal syncope is initiated by anything that leads to strong contractions in an 'empty' heart
Orthostatic hypotension is characterized by autonomic failure, with a lack of compensatory increase in vascular resistance or heart rate upon orthostasis, or by significant hypovolemia that cannot be overcome by sympathetic mechanisms. It is defined as a drop in systolic blood pressure of 20 mm Hg or more or a drop in diastolic pressure of 10 mm Hg or more after 30 seconds to 5 minutes of upright posture. Blood pressure is checked immediately upon standing and at 3 and 5 minutes. This may be done at the bedside or during tilt-table testing.2,4
Some patients have an immediate drop in blood pressure of more than 40 mm Hg upon standing, with a quick return to normal within 30 seconds. This "initial orthostatic hypotension" may be common in elderly patients taking antihypertensive drugs and may elude detection during standard blood pressure measurement.2 Other patients with milder orthostatic hypotension may develop a more delayed hypotension 10 to 15 minutes later, as more blood pools in the periphery.16
Along with the drop in blood pressure, a failure of the heart rate to increase identifies autonomic dysfunction. On the other hand, an increase in the heart rate of more than 20 to 30 beats per minute may signify a hypovolemic state even if blood pressure is maintained, the lack of blood pressure drop being related to the excessive heart rate increase.
Orthostatic hypotension is the most common cause of syncope in the elderly and may be due to autonomic dysfunction (related to age, diabetes, uremia, or Parkinson disease), volume depletion, or drugs that block autonomic effects or cause hypovolemia, such as vasodilators, beta-blockers, diuretics, neuropsychiatric medications, and alcohol.
Since digestion leads to peripheral vasodilation and splanchnic blood pooling, syncope that occurs within 1 hour after eating has a mechanism similar to that of orthostatic syncope.
Supine hypertension with orthostatic hypotension. Some patients with severe autonomic dysfunction and the inability to regulate vascular tone have severe hypertension when supine and significant hypotension when upright.
Postural orthostatic tachycardia syndrome, another form of orthostatic failure, occurs most frequently in young women (under the age of 50). In this syndrome, autonomic dysfunction affects peripheral vascular resistance, which fails to increase in response to orthostatic stress. This autonomic dysfunction does not affect the heart, which manifests a striking compensatory increase in rate of more than 30 beats per minute within the first 10 minutes of orthostasis, or an absolute heart rate greater than 120 beats per minute. Unlike in orthostatic hypotension, blood pressure and cardiac output are maintained through this increase in heart rate, although the patient still develops symptoms of severe fatigue or near-syncope, possibly because of flow maldistribution and reduced cerebral flow.2
While postural orthostatic tachycardia syndrome per se does not induce syncope,2 it may be associated with a vasovagal form of syncope that occurs beyond the first 10 minutes of orthostasis in up to 38% of these patients.17
In a less common, hyperadrenergic form of postural orthostatic tachycardia syndrome, there is no autonomic failure but the sympathetic system is overly activated, with orthostasis leading to excessive tachycardia.10,18
CARDIAC SYNCOPE
Accounting for 10% to 20% of cases of syncope, a cardiac cause is the main concern in patients presenting with syncope, as cardiac syncope predicts an increased risk of death and may herald sudden cardiac death.1,2,8,19,20 It often occurs suddenly without any warning signs, in which case it is called malignant syncope. Unlike what occurs in neurally mediated syncope, the postrecovery period is not usually marked by lingering malaise.
There are three forms of cardiac syncope:
Syncope due to structural heart disease with cardiac obstruction
In cases of aortic stenosis, hypertrophic obstructive cardiomyopathy, or severe pulmonary arterial hypertension, peripheral vasodilation occurs during exercise, but cardiac output cannot increase because of the fixed or dynamic obstruction to the ventricular outflow. Since blood pressure is equal to cardiac output times peripheral vascular resistance, pressure drops with the reduction in peripheral vascular resistance. Exertional ventricular arrhythmias may also occur in these patients. Conversely, postexertional syncope is usually benign.
Syncope due to ventricular tachycardia
Ventricular tachycardia can be secondary to underlying structural heart disease, with or without reduced ejection fraction, such as coronary arterial disease, hypertrophic cardiomyopathy, hypertensive cardiomyopathy, or valvular disease. It can also be secondary to primary electrical disease (eg, long QT syndrome, Wolff-Parkinson-White syndrome, Brugada syndrome, arrhythmogenic right ventricular dysplasia, sarcoidosis).
Occasionally, fast supraventricular tachycardia causes syncope at its onset, before vascular compensation develops. This occurs in patients with underlying heart disease.2,8,19
Syncope from bradyarrhythmias
Bradyarrhythmias can occur with or without underlying structural heart disease. They are most often related to degeneration of the conduction system or to medications rather than to cardiomyopathy.
Caveats
When a patient with a history of heart failure presents with syncope, the top considerations are ventricular tachycardia and bradyarrhythmia. Nevertheless, about half of cases of syncope in patients with cardiac disease have a noncardiac cause,19 including the hypotensive or bradycardiac side effect of drugs.
As noted above, most cases of syncope are neurally mediated. However, long asystolic pauses due to sinus or atrioventricular nodal block are the most frequent mechanism of unexplained syncope and are seen in more than 50% of syncope cases on prolonged rhythm monitoring.1,21 These pauses may be related to intrinsic sinus or atrioventricular nodal disease or, more commonly, to extrinsic effects such as the vasovagal mechanism. Some experts favor classifying and treating syncope on the basis of the final mechanism rather than the initiating process, but this is not universally accepted.1,22
OTHER CAUSES OF SYNCOPE
Acute medical or cardiovascular illnesses can cause syncope and are looked for in the appropriate clinical context: severe hypovolemia or gastrointestinal bleeding, large pulmonary embolus with hemodynamic compromise, tamponade, aortic dissection, or hypoglycemia.
Bilateral critical carotid disease or severe vertebrobasilar disease very rarely cause syncope, and, when they do, they are associated with focal neurologic deficits.2 Vertebrobasilar disease may cause "drop attacks," ie, a loss of muscular tone with falling but without loss of consciousness.23
Severe proximal subclavian disease leads to reversal of the flow in the ipsilateral vertebral artery as blood is shunted toward the upper extremity. It manifests as dizziness and syncope during the ipsilateral upper extremity activity, usually with focal neurologic signs (subclavian steal syndrome).2
Psychogenic pseudosyncope is characterized by frequent attacks that typically last longer than true syncope and occur multiple times per day or week, sometimes with a loss of motor tone.2 It occurs in patients with anxiety or somatization disorders.
SEIZURE: A SYNCOPE MIMIC
Certain features differentiate seizure from syncope:
In seizure, unconsciousness often lasts longer than 5 minutes
After a seizure, the patient may experience postictal confusion or paralysis
Seizure may include prolonged tonic-clonic movements; although these movements may be seen with any form of syncope lasting more than 30 seconds, the movements during syncope are more limited and brief, lasting less than 15 seconds
Tongue biting strongly suggests seizure.
Urinary incontinence does not help distinguish the two, as it frequently occurs with syncope as well as seizure.
DIAGNOSTIC EVALUATION OF SYNCOPE
Table 2 lists clinical clues to the type of syncope.2–5,8
Underlying structural heart disease is the most important predictor of ventricular arrhythmia and death.20,24–26 Thus, the primary goal of the evaluation is to rule out structural heart disease by history, examination, electrocardiography, and echocardiography (Figure 1).
Initial strategy for finding the cause
Figure 1. Management of syncope.
The cause of syncope is diagnosed by history and physical examination alone in up to 50% of cases, mainly neurally mediated syncope, orthostatic syncope, or seizure.2,3,19
Always check blood pressure with the patient both standing and sitting and in both arms, and obtain an electrocardiogram.
Perform carotid massage in all patients over age 50 if syncope is not clearly vasovagal or orthostatic and if cardiac syncope is not likely. Carotid massage is contraindicated if the patient has a carotid bruit or a history of stroke.
Electrocardiography establishes or suggests a diagnosis in 10% of patients (Table 3, Figure 2).1,2,8,19 A normal electrocardiogram or a mild nonspecific ST-T abnormality suggests a low likelihood of cardiac syncope and is associated with an excellent prognosis. Abnormal electrocardiographic findings are seen in 90% of cases of cardiac syncope and in only 6% of cases of neurally mediated syncope.27 In one study of syncope patients with normal electrocardiograms and negative cardiac histories, none had an abnormal echocardiogram.28
If the heart is normal
If the history suggests neurally mediated syncope or orthostatic hypotension and the history, examination, and electrocardiogram do not suggest coronary artery disease or any other cardiac disease, the workup is stopped.
If the patient has signs or symptoms of heart disease
If the patient has signs or symptoms of heart disease (angina, exertional syncope, dyspnea, clinical signs of heart failure, murmur), a history of heart disease, or exertional, supine, or malignant features, heart disease should be looked for and the following performed:
Echocardiography to assess left ventricular function, severe valvular disease, and left ventricular hypertrophy
A stress test (possibly) in cases of exertional syncope or associated angina; however, the overall yield of stress testing in syncope is low (< 5%).29
If electrocardiography and echocardiography do not suggest heart disease
Figure 2. Second-degree Mobitz II atrioventricular block, with 3:2 block alternating with 2:1 block (arrows point to P waves). As seen in lead V1, right bundle branch block alternates with left bundle branch block. Beside Mobitz II block, the alternation of right and left bundle branch block indicates infranodal atrioventricular block. In fact, QRS is dropped when both bundles simultaneously block in a patient with underlying right bundle branch block, left bundle branch block, or alternating right and left bundle branch block. RBBB = right bundle branch block; LBBB = left bundle branch block
Often, in this situation, the workup can be stopped and syncope can be considered neurally mediated. The likelihood of cardiac syncope is very low in patients with normal findings on electrocardiography and echocardiography, and several studies have shown that patients with syncope who have no structural heart disease have normal long-term survival rates.20,26,30
The following workup may, however, be ordered if the presentation is atypical and syncope is malignant, recurrent, or associated with physical injury, or occurs in the supine position19:
Carotid sinus massage in patients over age 50, if not already performed. Up to 50% of these patients with unexplained syncope have carotid sinus hypersensitivity.13
24-hour Holter monitoring rarely detects significant arrhythmias, but if syncope or dizziness occurs without any arrhythmia, Holter monitoring rules out arrhythmia as the cause of the symptoms.31 The diagnostic yield of Holter monitoring is low (1% to 2%) in patients with infrequent symptoms1,2 and is not improved with 72-hour monitoring.30 The yield is higher in patients with very frequent daily symptoms, many of whom have psychogenic pseudosyncope.2
Tilt-table testing to diagnose vasovagal syncope. This test is positive for a vasovagal response in up to 66% of patients with unexplained syncope.1,19 Patients with heart disease taking vasodilators or beta-blockers may have abnormal baroreflexes. Therefore, a positive tilt test is less specific in these patients and does not necessarily indicate vasovagal syncope.
Event monitoring. If the etiology remains unclear or there are some concerns about arrhythmia, an event monitor (4 weeks of external rhythm monitoring) or an implantable loop recorder (implanted subcutaneously in the prepectoral area for 1 to 2 years) is placed. These monitors record the rhythm when the rate is lower or higher than predefined cutoffs or when the rhythm is irregular, regardless of symptoms. The patient or an observer can also activate the event monitor during or after an event, which freezes the recording of the 2 to 5 minutes preceding the activation and the 1 minute after it.
In a patient who has had syncope, a pacemaker is indicated for episodes of high-grade atrioventricular block, pauses longer than 3 seconds while awake, or bradycardia (< 40 beats per minute) while awake, and an implantable cardioverter-defibrillator is indicated for sustained ventricular tachycardia, even if syncope does not occur concomitantly with these findings. The finding of nonsustained ventricular tachycardia on monitoring increases the suspicion of ventricular tachycardia as the cause of syncope but does not prove it, nor does it necessarily dictate implantation of a cardioverter-defibrillator device.
An electrophysiologic study has a low yield in patients with normal electrocardiographic and echocardiographic studies. Bradycardia is detected in 10%.31
If heart disease or a rhythm abnormality is found
If heart disease is diagnosed by echocardiography or if significant electrocardiographic abnormalities are found, perform the following:
Pacemaker placement for the following electrocardiographic abnormalities1,2,19:
Second-degree Mobitz II or third-degree atrioventricular block
Sinus pause (> 3 seconds) or bradycardia (< 40 beats per minute) while awake
Alternating left bundle branch block and right bundle branch block on the same electrocardiogram or separate ones.
Telemetric monitoring (inpatient).
An electrophysiologic study is valuable mainly for patients with structural heart disease, including an ejection fraction 36% to 49%, coronary artery disease, or left ventricular hypertrophy with a normal ejection fraction.32 Overall, in patients with structural heart disease and unexplained syncope, the yield is 55% (inducible ventricular tachycardia in 21%, abnormal indices of bradycardia in 34%).31
However, the yield of electrophysiologic testing is low in bradyarrhythmia and in patients with an ejection fraction of 35% or less.33 In the latter case, the syncope is often arrhythmia-related and the patient often has an indication for an implantable cardioverter-defibrillator regardless of electrophysiologic study results, especially if the low ejection fraction has persisted despite medical therapy.32
If the electrophysiologic study is negative
If the electrophysiologic study is negative, the differential diagnosis still includes arrhythmia, as the yield of electrophysiologic study is low for bradyarrhythmias and some ventricular tachycardias, and the differential diagnosis also includes, at this point, neurally mediated syncope.
The next step may be either prolonged rhythm monitoring or tilt-table testing. An event monitor or an implantable loop recorder can be placed for prolonged monitoring. The yield of the 30-day event monitor is highest in patients with frequently recurring syncope, in whom it reaches a yield of up to 40% (10% to 20% will have a positive diagnosis of arrhythmia, while 15% to 20% will have symptoms with a normal rhythm).31,34 The implantable recorder has a high overall diagnostic yield and is used in patients with infrequent syncopal episodes (yield up to 50%).1,35,36
In brief, there are two diagnostic approaches to unexplained syncope: the monitoring approach (loop recorder) and the testing approach (tilt-table testing). A combination of both strategies is frequently required in patients with unexplained syncope, and, according to some investigators, a loop recorder may be implanted early on.21
Heart disease with left ventricular dysfunction and low ejection fraction
Carotid massage is indicated in cases of unexplained syncope regardless of circumstantial triggers
In patients with heart disease with left ventricular dysfunction and an ejection fraction of 35% or less, an implantable cardioverter-defibrillator can be placed without the need for an electrophysiologic study. These patients need these devices anyway to prevent sudden death, even if the cause of syncope is not an arrhythmia. Patients with a low ejection fraction and a history of syncope are at a high risk of sudden cardiac death.32 Yet in some patients with newly diagnosed cardiomyopathy, left ventricular function may improve with medical therapy. Because the arrhythmic risk is essentially high during the period of ventricular dysfunction, a wearable external defibrillator may be placed while the decision about an implantable defibrillator is finalized within the ensuing months.
In patients with hypertrophic cardiomyopathy, place an implantable cardioverter-defibrillator after any unexplained syncopal episode.
Valvular heart disease needs surgical correction.
If ischemic heart disease is suspected, coronary angiography is indicated, with revascularization if appropriate. An implantable cardioverter-defibrillator should be placed if the ejection fraction is lower than 35%. Except in a large acute myocardial infarction, the substrate for ventricular tachycardia is not ameliorated with revascularization.32,37 Consider an electrophysiologic study when syncope occurs with coronary artery disease and a higher ejection fraction.
A note on left or right bundle branch block
Patients with left or right bundle branch block and unexplained syncope (not clearly vasovagal or orthostatic) likely have syncope related to intermittent high-grade atrioventricular block.38
One study monitored these patients with an implanted loop recorder and showed that about 40% had a recurrence of syncope within 48 days, often concomitantly with complete atrioventricular block. About 55% of these patients had a major event (syncope or high-grade atrioventricular block).39 Many of the patients had had a positive tilt test; thus, tilt testing is not specific for vasovagal syncope in these patients and should not be used to exclude a bradyarrhythmic syncope. Also, patients selected for this study had undergone carotid sinus massage and an electrophysiology study with a negative result.
Underlying structural heart disease is the most important predictor of ventricular arrhythmia and death
In another analysis, an electrophysiologic study detected a proportion of the bradyarrhythmias but, more importantly, it induced ventricular tachycardia in 14% of patients with right or left bundle branch block. Although it is not sensitive enough for bradyarrhythmia, electrophysiologic study was highly specific and fairly sensitive for the occurrence of ventricular tachycardia on follow-up.38 Thus, unexplained syncope in a patient with right or left bundle branch block may warrant carotid sinus massage, then an electrophysiologic study to rule out ventricular tachycardia, followed by placement of a dual-chamber pacemaker if the study is negative for ventricular tachycardia, or at least placement of a loop recorder.
INDICATIONS FOR HOSPITALIZATION
Patients should be hospitalized if they have severe hypovolemia or bleeding, or if there is any suspicion of heart disease by history, examination, or electrocardiography, including:
History of heart failure, low ejection fraction, or coronary artery disease
An electrocardiogram suggestive of arrhythmia (Table 3)
Family history of sudden death
Lack of prodromes; occurrence of physical injury, exertional syncope, syncope in a supine position, or syncope associated with dyspnea or chest pain.2,40
In these situations, there is concern about arrhythmia, structural heart disease, or acute myocardial ischemia. The patient is admitted for immediate telemetric monitoring. Echocardiography and sometimes stress testing are performed. The patient is discharged if this initial workup does not suggest underlying heart disease. Alternatively, an electrophysiologic study is performed or a device is placed in patients found to have structural heart disease. Prolonged rhythm monitoring or tilt-table testing may be performed when syncope with underlying heart disease or worrisome features remains unexplained.
Several Web-based interactive algorithms have been used to determine the indication for hospitalization. They incorporate the above clinical, electrocardiographic, and sometimes echocardiographic features.2,24,25,40–42 A cardiology consultation is usually necessary in patients with the above features, as they frequently require specialized cardiac testing.
Among high-risk patients, the risk of sudden death, a major cardiovascular event, or significant arrhythmia is high in the first few days after the index syncopal episode, justifying the hospitalization and inpatient rhythm monitoring and workup in the presence of the above criteria.24,40,42
SYNCOPE AND DRIVING
A study has shown that the most common cause of syncope while driving is vasovagal syncope.6 In all patients, the risk of another episode of syncope was relatively higher during the first 6 months after the event, with a 12% recurrence rate during this period. However, recurrences were often also seen more than 6 months later (12% recurrence between 6 months and the following few years).6 Fortunately, those episodes rarely occurred while the patient was driving. In a study in survivors of ventricular arrhythmia, the risk of recurrence of arrhythmic events was highest during the first 6 to 12 months after the event.43
Thus, in general, patients with syncope should be prohibited from driving for at least the period of time (eg, 6 months) during which the risk of a recurrent episode of syncope is highest and during which serious cardiac disease or arrhythmia, if present, would emerge. Recurrence of syncope is more likely and more dangerous for commercial drivers who spend a significant proportion of their time driving; individualized decisions are made in these cases.
References
Brignole M, Hamdan MH. New concepts in the assessment of syncope. J Am Coll Cardiol 2012; 59:1583–1591.
Task Force for the Diagnosis and Management of Syncope; European Society of Cardiology (ESC); European Heart Rhythm Association (EHRA); Heart Failure Association (HFA); Heart Rhythm Society (HRS); Moya A, Sutton R, Ammirati F, et al. Guidelines for the diagnosis and management of syncope (version 2009 Eur Heart J 2009; 30:2631–2671.
Kapoor WN. Syncope. N Engl J Med 2000; 343:1856–1862.
Graham LA, Kenny RA. Clinical characteristics of patients with vasovagal reactions presenting as unexplained syncope. Europace 2001; 3:141–146.
Calkins H, Shyr Y, Frumin H, Schork A, Morady F. The value of the clinical history in the differentiation of syncope due to ventricular tachycardia, atrioventricular block, and neurocardiogenic syncope. Am J Med 1995; 98:365–373.
Sorajja D, Nesbitt GC, Hodge DO, et al. Syncope while driving: clinical characteristics, causes, and prognosis. Circulation 2009; 120:928–934.
Kochiadakis GE, Papadimitriou EA, Marketou ME, Chrysostomakis SI, Simantirakis EN, Vardas PE. Autonomic nervous system changes in vasovagal syncope: is there any difference between young and older patients? Pacing Clin Electrophysiol 2004; 27:1371–1377.
Alboni P, Brignole M, Menozzi C, et al. Diagnostic value of history in patients with syncope with or without heart disease. J Am Coll Cardiol 2001; 37:1921–1928.
Brignole M, Alboni P, Benditt D, et al; Task Force on Syncope; European Society of Cardiology. Task force on syncope, European Society of Cardiology. Part 1. The initial evaluation of patients with syncope. Europace 2001; 3:253–260.
Grubb BP. Neurocardiogenic syncope and related disorders of orthostatic intolerance. Circulation 2005; 111:2997–3006.
Brignole M, Menozzi C, Del Rosso A, et al. New classification of haemodynamics of vasovagal syncope: beyond the VASIS classification. Analysis of the pre-syncopal phase of the tilt test without and with nitroglycerin challenge. Vasovagal Syncope International Study. Europace 2000; 2:66–76.
Grubb BP, Kosinski D. Tilt table testing: concepts and limitations. Pacing Clin Electrophysiol 1997; 20:781–787.
Brignole M, Menozzi C, Gianfranchi L, Oddone D, Lolli G, Bertulla A. Carotid sinus massage, eyeball compression, and head-up tilt test in patients with syncope of uncertain origin and in healthy control subjects. Am Heart J 1991; 122:1644–1651.
Maggi R, Menozzi C, Brignole M, et al. Cardioinhibitory carotid sinus hypersensitivity predicts an asystolic mechanism of spontaneous neurally mediated syncope. Europace 2007; 9:563–567.
Kenny RA, Richardson DA, Steen N, Bexton RS, Shaw FE, Bond J. Carotid sinus syndrome: a modifiable risk factor for nonaccidental falls in older adults (SAFE PACE). J Am Coll Cardiol 2001; 38:1491–1496.
Gibbons CH, Freeman R. Delayed orthostatic hypotension: a frequent cause of orthostatic intolerance. Neurology 2006; 67:28–32.
Ojha A, McNeeley K, Heller E, Alshekhlee A, Chelimsky G, Chelimsky TC. Orthostatic syndromes differ in syncope frequency. Am J Med 2010; 123:245–249.
Kanjwal Y, Kosinski D, Grubb BP. The postural orthostatic tachycardia syndrome: definitions, diagnosis, and management. Pacing Clin Electrophysiol 2003; 26:1747–1757.
Brignole M, Alboni P, Benditt D, et al; Task Force on Syncope; European Society of Cardiology. Guidelines on management (diagnosis and treatment) of syncope. Eur Heart J 2001; 22:1256–1306.
Soteriades ES, Evans JC, Larson MG, et al. Incidence and prognosis of syncope. N Engl J Med 2002; 347:878–885.
Brignole M, Sutton R, Menozzi C, et al; International Study on Syncope of Uncertain Etiology 2 (ISSUE 2) Group. Early application of an implantable loop recorder allows effective specific therapy in patients with recurrent suspected neurally mediated syncope. Eur Heart J 2006; 27:1085–1092.
Brignole M, Menozzi C, Moya A, et al; International Study on Syncope of Uncertain Etiology 3 (ISSUE-3) Investigators. Pacemaker therapy in patients with neurally mediated syncope and documented asystole: Third International Study on Syncope of Uncertain Etiology (ISSUE-3): a randomized trial. Circulation 2012; 125:2566–2571.
Kubak MJ, Millikan CH. Diagnosis, pathogenesis, and treatment of "drop attacks." Arch Neurol 1964; 11:107–113.
Quinn J, McDermott D, Stiell I, Kohn M, Wells G. Prospective validation of the San Francisco Syncope Rule to predict patients with serious outcomes. Ann Emerg Med 2006; 47:448–454.
Colivicchi F, Ammirati F, Melina D, Guido V, Imperoli G, Santini M; OESIL (Osservatorio Epidemiologico sulla Sincope nel Lazio) Study Investigators. Development and prospective validation of a risk stratification system for patients with syncope in the emergency department: the OESIL risk score. Eur Heart J 2003; 24:811–819.
Kapoor WN, Hanusa BH. Is syncope a risk factor for poor outcomes? Comparison of patients with and without syncope. Am J Med 1996; 100:646–655.
Sarasin FP, Louis-Simonet M, Carballo D, et al. Prospective evaluation of patients with syncope: a population-based study. Am J Med 2001; 111:177–184.
Sarasin FP, Junod AF, Carballo D, Slama S, Unger PF, Louis-Simonet M. Role of echocardiography in the evaluation of syncope: a prospective study. Heart 2002; 88:363–367.
AlJaroudi WA, Alraies MC, Wazni O, Cerqueira MD, Jaber WA. Yield and diagnostic value of stress myocardial perfusion imaging in patients without known coronary artery disease presenting with syncope. Circ Cardiovasc Imaging 2013; 6:384–391.
Ungar A, Del Rosso A, Giada F, et al; Evaluation of Guidelines in Syncope Study 2 Group. Early and late outcome of treated patients referred for syncope to emergency department: the EGSYS 2 follow-up study. Eur Heart J 2010; 31:2021–2026.
Linzer M, Yang EH, Estes NA 3rd, Wang P, Vorperian VR, Kapoor WN. Diagnosing syncope. Part 2: Unexplained syncope. Clinical Efficacy Assessment Project of the American College of Physicians. Ann Intern Med 1997; 127:76–86.
Strickberger SA, Benson DW, Biaggioni I, et al; American Heart Association Councils on Clinical Cardiology, Cardiovascular Nursing, Cardiovascular Disease in the Young, and Stroke; Quality of Care and Outcomes Research Interdisciplinary Working Group; American College of Cardiology Foundation; Heart Rhythm Society. AHA/ACCF scientific statement on the evaluation of syncope: from the American Heart Association Councils on Clinical Cardiology, Cardiovascular Nursing, Cardiovascular Disease in the Young, and Stroke, and the Quality of Care and Outcomes Research Interdisciplinary Working Group; and the American College of Cardiology Foundation In Collaboration With the Heart Rhythm Society. J Am Coll Cardiol 2006; 47:473–484.
Fujimura O, Yee R, Klein GJ, Sharma AD, Boahene KA. The diagnostic sensitivity of electrophysiologic testing in patients with syncope caused by transient bradycardia. N Engl J Med 1989; 321:1703–1707.
Linzer M, Pritchett EL, Pontinen M, McCarthy E, Divine GW. Incremental diagnostic yield of loop electrocardiographic recorders in unexplained syncope. Am J Cardiol 1990; 66:214–219.
Edvardsson N, Frykman V, van Mechelen R, et al; PICTURE Study Investigators. Use of an implantable loop recorder to increase the diagnostic yield in unexplained syncope: results from the PICTURE registry. Europace 2011; 13:262–269.
Brignole M, Sutton R, Menozzi C, et al; International Study on Syncope of Uncertain Etiology 2 (ISSUE 2) Group. Early application of an implantable loop recorder allows effective specific therapy in patients with recurrent suspected neurally mediated syncope. Eur Heart J 2006; 27:1085–1092.
Brugada J, Aguinaga L, Mont L, Betriu A, Mulet J, Sanz G. Coronary artery revascularization in patients with sustained ventricular arrhythmias in the chronic phase of a myocardial infarction: effects on the electrophysiologic substrate and outcome. J Am Coll Cardiol 2001; 37:529–533.
Moya A, García-Civera R, Croci F, et al; Bradycardia detection in Bundle Branch Block (B4) study. Diagnosis, management, and outcomes of patients with syncope and bundle branch block. Eur Heart J 2011; 32:1535–1541.
Brignole M, Menozzi C, Moya A, et al; International Study on Syncope of Uncertain Etiology (ISSUE) Investigators. Mechanism of syncope in patients with bundle branch block and negative electrophysiological test. Circulation 2001; 104:2045–2050.
Brignole M, Shen WK. Syncope management from emergency department to hospital. J Am Coll Cardiol 2008; 51:284–287.
Daccarett M, Jetter TL, Wasmund SL, Brignole M, Hamdan MH. Syncope in the emergency department: comparison of standardized admission criteria with clinical practice. Europace 2011; 13:1632–1638.
Costantino G, Perego F, Dipaola F, et al; STePS Investigators. Short- and long-term prognosis of syncope, risk factors, and role of hospital admission: results from the STePS (Short-Term Prognosis of Syncope) study. J Am Coll Cardiol 2008; 51:276–283.
Larsen GC, Stupey MR, Walance CG, et al. Recurrent cardiac events in survivors of ventricular fibrillation or tachycardia. Implications for driving restrictions. JAMA 1994; 271:1335–1339.
Neurally mediated forms of syncope, such as vasovagal, result from autonomic reflexes that respond inappropriately, leading to vasodilation and relative bradycardia.
Orthostatic hypotension is the most common cause of syncope in the elderly and may be due to autonomic dysfunction, volume depletion, or drugs that block autonomic effects or cause hypovolemia, such as vasodilators, beta-blockers, diuretics, neuropsychiatric medications, and alcohol.
The likelihood of cardiac syncope is low in patients with normal electrocardiographic and echocardiographic findings.
Hospitalization is indicated in patients with syncope who have or are suspected of having structural heart disease.
Disallow All Ads
Alternative CME
Consolidated Pubs: Do Not Show Source Publication Logo
Depression of the ST segment and inversion of the T wave are common electrocardiographic abnormalities. Knowing the various ischemic and nonischemic morphologic features is critical for a timely diagnosis of high-risk myocardial ischemia and electrolyte- or drug-related abnormalities. Moreover, it is important to recognize that true posterior infarction or subtle ST-segment elevation infarction may masquerade as ST-segment depression ischemia, and that pulmonary embolism may masquerade as anterior ischemia. These common electrocardiographic abnormalities are summarized in Table 1.
THE ST SEGMENT AND THE T WAVE: A PRIMER
Abnormalities of the ST segment and the T wave represent abnormalities of ventricular repolarization.
The ST segment corresponds to the plateau phase of ventricular repolarization (phase 2 of the action potential), while the T wave corresponds to the phase of rapid ventricular repolarization (phase 3). ST-segment or T-wave changes may be secondary to abnormalities of depolarization, ie, pre-excitation or abnormalities of QRS voltage or duration.
On the other hand, ST-segment and T-wave abnormalities may be unrelated to any QRS abnormality, in which case they are called primary repolarization abnormalities. These are caused by ischemia, pericarditis, myocarditis, drugs (digoxin, antiarrhythmic drugs), and electrolyte abnormalities, particularly potassium abnormalities.
ST-segment deviation is usually measured at its junction with the end of the QRS complex, ie, the J point, and is referenced against the TP or PR segment.1 But some prefer to measure the magnitude of the ST-segment deviation 40 to 80 ms after the J point, when all myocardial fibers are expected to have reached the same level of membrane potential and to form an isoelectric ST segment; at the very onset of repolarization, small differences in membrane potential may normally be seen and may cause deviation of the J point and of the early portion of the ST segment.2
Although a diagnosis of ST-segment elevation myocardial infarction (STEMI) that mandates emergency reperfusion therapy requires ST-segment elevation greater than 1 mm in at least two contiguous leads,3 any ST-segment depression or elevation (≥ 0.5 mm, using the usual standard of 1.0 mV = 10 mm) may be abnormal, particularly when the clinical context or the shape of the ST segment suggests ischemia, or when other ischemic signs such as T-wave abnormalities, Q waves, or reciprocal ST-segment changes are concomitantly present. On the other hand, ST-segment depression of up to 0.5 mm in leads V2 and V3 and 1 mm in the other leads may be normal.1
In adults, the T wave normally is inverted in lead aVR; is upright or inverted in leads aVL, III, and V1; and is upright in leads I, II, aVF, and V2 through V6. The T wave is considered inverted when it is deeper than 1 mm; it is considered flat when its peak amplitude is between 1.0 mm and −1.0 mm.1
As we will discuss, certain features allow the various causes of ST-segment and T-wave abnormalities to be distinguished from one another.
SECONDARY ST-SEGMENT AND T-WAVE ABNORMALITIES
Modified with permission from Hanna EB, Quintal R, Jain N. Cardiology: Handbook for Clinicians. Arlington, VA: Scrubhill Press; 2009:328–354.
Figure 1. ST-segment and T-wave morphologies in cases of secondary abnormalities (A) and ischemic abnormalities (B–E).In secondary ST-segment or T-wave abnormalities, QRS criteria for left or right ventricular hypertrophy or left or right bundle branch block or pre-excitation are usually present, and the ST segment and T wave have all of the following morphologic features (Figure 1A):
The ST segment and T wave are directed opposite to the QRS: this is called discordance between the QRS complex and the ST-T abnormalities. In the case of right bundle branch block, the ST and T are directed opposite to the terminal portion of the QRS, ie, the part of the QRS deformed by the conduction abnormality.
The ST segment and T wave are both abnormal and deviate in the same direction, ie, the ST segment is down-sloping and the T wave is inverted in leads with an upright QRS complex, which gives the ST-T complex a “reverse checkmark” asymmetric morphology.
The ST and T abnormalities are not dynamic, ie, they do not change in the course of several hours to several days.
Figure 2. Example of left ventricular hypertrophy with typical secondary ST-T abnormalities in leads I, II, aVL, V4, V5, and V6. The QRS complex is upright in these leads while the ST segment and T wave are directed in the opposite direction, ie, the QRS and the ST-T complexes are discordant.
Thus, in cases of left ventricular hypertrophy or left bundle branch block, since the QRS complex is upright in the left lateral leads I, aVL, V5, and V6, the ST segment is characteristically depressed and the T wave is inverted in these leads (Figure 2). In cases of right ventricular hypertrophy or right bundle branch block, T waves are characteristically inverted in the right precordial leads V1, V2, and V3.
Left bundle branch block is always associated with secondary ST-T abnormalities, the absence of which suggests associated ischemia. Left and right ventricular hypertrophy, on the other hand, are not always associated with ST-T abnormalities, but when these are present, they correlate with more severe hypertrophy or ventricular systolic dysfunction,4 and have been called strain pattern. In addition, while these morphologic features are consistent with secondary abnormalities, they do not rule out ischemia in a patient with angina.
Some exceptions to these typical morphologic features:
Right ventricular hypertrophy and right bundle branch block may be associated with isolated T-wave inversion without ST-segment depression in precordial leads V1, V2, and V3.
Left ventricular hypertrophy may be associated with symmetric T-wave inversion without ST-segment depression or with a horizontally depressed ST segment. This may be the case in up to one-third of ST-T abnormalities secondary to left ventricular hypertrophy and is seen in hypertrophic cardiomyopathy, particularly the apical variant, in leads V3 through V6.5
ISCHEMIC ST-SEGMENT DEPRESSION, T-WAVE INVERSION, OR BOTH
ST-segment depression or T-wave inversion is consistent with ischemia if any of the following is true:
The ST-segment depression or T-wave inversion is directed in the same direction as the QRS complex: this is called concordance between the QRS complex and the ST or T abnormality (Figure 1B).
The ST segment is depressed but the T wave is upright (Figure 1C).
The T wave has a positive-negative biphasic pattern (Figure 1D).
The T wave is symmetrically inverted and has a pointed configuration, while the ST segment is not deviated or is upwardly bowed (coved) or horizontally depressed (Figure 1E).
The magnitude of ST-segment depression progresses or regresses on serial tracings, or ST-segment depression progresses to T-wave abnormality during ischemia-free intervals (dynamic ST-segment depression).
Figure 3. Electrocardiogram of a patient with angina at rest and elevated cardiac biomarkers. ST-segment depression in nine leads with elevation in leads aVR and V1 suggested subendocardial ischemia related to three-vessel or left main coronary artery disease. He had severe three-vessel disease on coronary arteriography.
Unlike ST-segment elevation, ST-segment depression does not localize ischemia.6 However, the extent and the magnitude of ST-segment depression correlate with the extent and the severity of ischemia. In fact, ST-segment depression in eight or more leads, combined with ST-segment elevation in leads aVR and V1 and occurring during ischemic pain, is associated with a 75% predictive accuracy for left main coronary artery or three-vessel disease (Figure 3).7,8 This finding may also be seen in cases of tight proximal stenosis of the left anterior descending coronary artery.9
Wellens syndrome
Figure 4. (A) Wellens-type biphasic T wave in leads V2 and V3 (arrows) and T-wave inversion in leads V4 and V5. (B) Wellens-type deep T-wave inversion in leads V2 to V4. Each patient had a 90% proximal left anterior descending stenosis at coronary arteriography.Either the positive-negative biphasic T waves of the type shown in Figure 1D or the deeply inverted (≥ 5 mm) T waves that often follow them, when occurring in the precordial leads V2 and V3, with or without similar changes in V1, V4, and V5, are nearly pathognomonic of very recent severe ischemia or injury in the distribution of the left anterior descending artery and characterize what is known as Wellens syndrome (Figure 4).10–13
Wellens and his colleagues showed that 75% of patients who developed these T-wave abnormalities and who were treated medically without angiographic investigation went on to develop extensive anterior wall myocardial infarction within a mean of 8.5 days.10
In a later investigation of 1,260 patients presenting with unstable angina, 180 patients (14%) had this characteristic T-wave pattern.11 All of the latter patients had stenosis of 50% or more in the proximal left anterior descending artery, and 18% had total occlusion of the left anterior descending artery.
Thus, although medical management may provide symptomatic improvement at first, early coronary angiography and revascularization should be strongly considered in anyone with Wellens syndrome because it usually predicts impending anterior myocardial infarction.
Wellens syndrome is characterized by two patterns of T-wave changes. In 75% of cases, T waves are deeply (≥ 5 mm) and symmetrically inverted in leads V2 through V4 (Figures 1E, 4B). In 25% of cases, the T wave has a characteristic positive-negative biphasic morphology in leads V2 through V4 (Figures 1D, 4A).10 In both patterns, the ST segment is isoelectric or minimally elevated (< 1 mm) with a straight or convex morphology, the down-slope of the T wave is sharp, and the QT interval is often prolonged. These abnormalities are characteristically seen hours to days after the ischemic chest pain resolves. In fact, the ischemic episode is usually associated with transient ST-segment elevation or depression that progresses to the T-wave abnormality after the pain subsides.11
In Wellens’ original description, only 12% of patients had increases in their creatine kinase levels, and these were small. Therefore, the electrocardiogram may be the only indication of an impending large anterior infarction in a chest-pain-free patient.12
T waves that are symmetrically but less deeply inverted than Wellens-type T waves may still represent ischemia. However, this finding is less specific for ischemia and is associated with better outcomes than Wellens syndrome or ST-segment deviation, particularly when the T wave is less than 3 mm deep.14 In fact, one prospective cohort study found that isolated mild T-wave inversion in patients presenting with acute coronary syndrome is associated with a favorable long-term outcome, similar to that in patients with no electrocardiographic changes.15
FREQUENTLY MISSED DIAGNOSES MANIFESTING AS ST-SEGMENT DEPRESSION OR T-WAVE INVERSION
When accompanied by inferior STEMI, posterior infarction is easily recognized, but it can be difficult to diagnose when it occurs alone, the so-called true posterior STEMI.
Figure 5. (A) ST-segment depression in the precordial leads V1–V4, with a maximal depression in lead V3, in a patient with severe ongoing chest pain for the preceding 3 hours. This suggests a posterior ST-segment elevation myocardial infarction. There is also a subtle ST-segment elevation in lead III, which further alludes to the diagnosis of inferoposterior infarction. Emergency coronary arteriography showed a totally occluded mid-left circumflex coronary artery. (B) The ST segment is depressed in leads V1 through V6 and leads II, III, and aVF, with a maximal depression in leads V2 and V3. In addition, tall R waves are seen in leads V1 and V2 and Q waves are seen in the lateral leads I and aVL accompanied by ST elevation in aVL. In a patient with severe persistent chest pain, this suggests a posterolateral infarct. Coronary arteriography showed a totally occluded second obtuse marginal branch.ST-segment depression that is most prominent in leads V1 through V3 often indicates posterior STEMI rather than non–ST-segment elevation ischemia and indicates the need for emergency revascularization. In fact, in the setting of posterior infarction, leads V1, V2, and V3 predominate as the areas of maximum depression, whereas greater ST-segment depression in the lateral precordial leads (V4, V5, and V6) or inferior leads (II, III, and aVF) is more indicative of nonocclusive and nonregional subendocardial ischemia (Figure 5).8,16–18
In most cases of posterior infarction, the posterior chest leads V7, V8, and V9 reveal ST-segment elevation.19 One study found that ST-segment depression in the anterior precordial leads was as sensitive as ST-segment elevation in leads V7 through V9 in identifying posterior myocardial infarction (sensitivity 80%),20 while other studies found that ST-segment deviation on standard 12-lead electrocardiography has a lower sensitivity (about 60%) in identifying posterior infarction.18,21
Tall or wide (≥ 0.04-s) R waves in leads V1 or V2, particularly when associated with upright T waves, suggest posterior infarction and may further corroborate this diagnosis, but this finding may take up to 24 hours to manifest and is seen in only about 50% of patients with posterior infarction.21
Studies have shown that ST-segment elevation on standard 12-lead electrocardiography is found in fewer than 50% of patients with acute left circumflex occlusion and inferoposterior infarction,18 yet these are cases of “missed” STEMI that indeed benefit from emergency angiography and reperfusion. In addition, studies of non–ST-segment elevation acute coronary syndrome consistently identify patients who have epicardial vessel occlusion (about 15%–20% of cases),18 yet their initial angiography is usually delayed for hours or days after the initial presentation.
A subgroup analysis from TRITON–TIMI 38 (Trial to Assess Improvement in Therapeutic Outcomes by Optimizing Platelet Inhibition With Prasugrel Thrombolysis in Myocardial Infarction 38) evaluated patients with isolated anterior ST-segment depression. An occluded “culprit” artery was found 26% of the time, most often the left circumflex artery. Moreover, those patients had a significantly higher rate of death or myocardial infarction at 30-day follow-up than patients without a culprit artery, probably related to delayed revascularization.22
Recognizing that ST-segment depression that is greatest in leads V1, V2, or V3 represents posterior infarction helps identify a portion of the missed STEMIs in a timely fashion. In addition, in cases of anterior ST-segment depression and in cases of chest pain with nondiagnostic electrocardiography, the recording of ST elevation in leads V7, V8, and V9 is highly sensitive for detecting a true posterior injury.
Acute pulmonary embolism
An anterior ischemic pattern of symmetric T-wave inversion in the precordial leads V1 through V4 may also be a sign of acute or chronic right ventricular strain, particularly acute pulmonary embolism. Sinus tachycardia is usually present, but other signs of pulmonary embolism, such as right ventricular hypertrophy and right bundle branch block, may be absent. In fact, T-wave inversion in leads V1 through V4 is noted in 19% of patients with nonmassive pulmonary embolism and in 85% of patients with massive pulmonary embolism, and is the most sensitive and specific electrocardiographic finding in massive pulmonary embolism.23
In addition, acute pulmonary embolism may be associated with T-wave inversion in leads III and aVF,24 and changes of concomitant anterior and inferior ischemia should always raise the question of this diagnosis.
In one retrospective study of patients with acute pulmonary embolism, nonspecific ST-segment or T-wave changes were the most common finding on electrocardiography, noted in 49%.25 Rapid regression of these changes on serial tracings favors pulmonary embolism rather than myocardial infarction.
ST-segment depression reciprocal to a subtle ST-segment elevation
When ST-segment elevation occurs in two contiguous standard leads while ST-segment depression occurs in other leads, and when the ST-segment and T-wave abnormalities are ischemic rather than secondary to depolarization abnormalities, ST-segment elevation is considered the primary ischemic abnormality whereas ST-segment depression is often considered a reciprocal “mirror image” change. This “reciprocal” change may also represent remote ischemia in a distant territory in patients with multivessel coronary disease.26,27
Reciprocal ST-segment depression is present in all patients with inferior myocardial infarction and in 70% of patients with anterior myocardial infarction.28
Figure 6. Example of subtle ST-segment elevation in two contiguous leads with a prominent ST-segment depression in other leads. The ST segment is depressed in leads I and aVL and V4, V5, and V6. There is a subtle ST-segment elevation with a broad hyperacute T wave in leads III and aVF fused with the ST segment in a convex fashion (arrows), suggesting that the primary abnormality is actually an acute inferior injury. Coronary arteriography showed a totally occluded right coronary artery in its mid-segment and severe left circumflex disease. The ST-segment depression is partly reciprocal to the inferior injury and partly a reflection of left circumflex-related ischemia.However, it is important to recognize that the magnitude of ST-segment elevation and reciprocal ST-segment depression is affected by the distance of the leads recording these changes from the ischemic region and their angle of deviation from the ischemic region.29 This explains why occasionally—and particularly when the overall amplitude of the QRS complex is low—the magnitude of ST-segment elevation is small, whereas the reciprocal ST-segment depression is more prominent. In fact, in the absence of left ventricular hypertrophy or left bundle branch block, the reciprocal ST-segment depression should be sought. It is of great utility in patients with acute cardiac symptoms and mild elevation of ST segments of 1 to 1.5 mm in two contiguous leads, as it strongly suggests the diagnosis of STEMI rather than other causes of mild ST-segment elevation (1–1.5 mm) (Figure 6).30 The less-pronounced ST-segment elevation is often overlooked, and the patient is erroneously diagnosed with non–ST-segment elevation acute coronary syndrome rather than STEMI. This has a marked impact on patient management, as STEMI requires emergency revascularization, while non–ST-segment elevation ischemia requires early (but not emergency) coronary angiography.
Hypokalemia and digitalis effect
Figure 7. (A) Note the progressive flattening of the T wave, increase in U wave amplitude, and depression of the ST segment with progressive levels of hypokalemia (serum potassium levels are expressed in mEq/L). (B) Electrocardiogram of a patient with a serum potassium level of 2.8 mEq/L. Note the flattened T waves (bars) and the prominent U waves (arrows).ST-segment depression, T-wave flattening, and prominent U waves are the hallmarks of hypokalemia and can be mistaken for ischemic changes, including ischemic lengthening of the QT interval (Figure 7).31–34 Digitalis also produces ST-segment depression, low or inverted T waves, and prominent U waves, but the U waves rarely are of the giant variety seen with severe hypokalemia, and the ST-segment depression has a sagging shape. In addition, digitalis shortens the QT interval.
DIFFUSE (GLOBAL) T-WAVE INVERSION
Reproduced with permission from Glancy DL, et al. Global T-wave inversion in a 77-year-old woman. Proc (Bayl Univ Med Cent) 2009; 22:81–82.
Figure 8. Global T-wave inversion with marked QT prolongation in a 77-year-old woman presenting with dyspnea and elevated cardiac biomarkers. Her coronary arteriography showed a 90% distal left main stenosis extending into the proximal left anterior descending and left circumflex coronary arteries.This term is applied when the T wave is inverted in most of the standard leads except aVR, which shows a reciprocal upright T wave. The QT interval is often prolonged, and T-wave inversion is often symmetric and “giant” (> 10 mm) (Figure 8).1,35
Walder and Spodick36 have found this pattern to be caused most often by myocardial ischemia or neurologic events, particularly intracranial hemorrhage, and it seems more prevalent in women. Other causes include hypertrophic cardiomyopathy, stress-induced cardiomyopathy (takotsubo cardiomyopathy), cocaine abuse, pericarditis, pulmonary embolism, and advanced or complete atrioventricular block.36,37
The prognosis in patients with global T-wave inversion is determined by the underlying disease, and the striking T-wave changes per se do not imply a poor prognosis.38
Figure 9. (A) Persistent juvenile T-wave pattern in a 40-year-old woman with T-wave inversion extending from lead V1 to lead V4. The depth of the inverted T waves decreases between V1 and V4. Also, the T wave progressively becomes less deeply inverted as the patient ages. (B) Normal variant terminal T-wave inversion with ST-segment elevation in leads V2 through V5 in a 21-year-old black man. This pattern is most often seen in young black men, a few of whom at other times manifest the typical early repolarization pattern. The age and clinical presentation distinguish this pattern from Wellens-type T waves.Of note, takotsubo cardiomyopathy is characterized by electrocardiographic changes that mimic ischemia, especially STEMI, and is often impossible to differentiate from myocardial ischemia related to a coronary event without performing coronary arteriography. The most common abnormality on the admission electrocardiogram is ST-segment elevation (present in 46%–100% of patients), typically seen in the precordial leads. Within 48 hours of presentation, almost all patients also develop postischemic diffuse T-wave inversion and prolongation of the QT interval. New Q waves may be seen in 6% to 31% of patients and are usually transient.39,40
OTHER CAUSES OF T-WAVE INVERSION OR ST-SEGMENT DEPRESSION
Various other entities may cause T-wave inversion, notably acute pericarditis or myocarditis, 41,42 memory T-wave phenomenon,43,44 and normal variants of repolarization (Table 1, Figure 9).45 Additionally, a nonpathologic junctional ST-segment depression may be seen in tachycardia (Figure 10).
Figure 10. (A) Up-sloping ST-segment depression in a case of sinus tachycardia. This is related to the exaggerated atrial repolarization that occurs during tachycardia and depresses the PR segment and the initial portion of the ST-segment when compared with the TP segment. (B) Electrocardiogram of a patient with sinus tachycardia and junctional ST-segment depression in leads II and V4 through V6. It has no pathologic significance.
References
Rautaharju PM, Surawicz B, Gettes LS, et al; American Heart Association Electrocardiography and Arrhythmias Committee, Council on Clinical Cardiology; American College of Cardiology Foundation; Heart Rhythm Society. AHA/ACCF/HRS recommendations for the standardization and interpretation of the electrocardiogram: part IV: the ST segment, T and U waves, and the QT interval: a scientific statement from the American Heart Association Electrocardiography and Arrhythmias Committee, Council on Clinical Cardiology; the American College of Cardiology Foundation; and the Heart Rhythm Society. Endorsed by the International Society for Computerized Electrocardiology. J Am Coll Cardiol2009; 53:982–991.
Antman EM, Anbe DT, Armstrong PW, et al. ACC/AHA guidelines for the management of patients with ST-elevation myocardial infarction; A report of the American College of Cardiology/American Heart Association Task Force on Practice Guidelines (Committee to Revise the 1999 Guidelines for the Management of patients with acute myocardial infarction). J Am Coll Cardiol2004; 44:E1–E211.
Okin PM, Devereux RB, Nieminen MS, et al; LIFE Study Investigators. Electrocardiographic strain pattern and prediction of new-onset congestive heart failure in hypertensive patients: the Losartan Intervention for Endpoint Reduction in Hypertension (LIFE) study. Circulation2006; 113:67–73.
Huwez FU, Pringle SD, Macfarlane PW. Variable patterns of ST-T abnormalities in patients with left ventricular hypertrophy and normal coronary arteries. Br Heart J1992; 67:304–307.
Li D, Li CY, Yong AC, Kilpatrick D. Source of electrocardiographic ST changes in subendocardial ischemia. Circ Res1998; 82:957–970.
Gorgels AP, Vos MA, Mulleneers R, de Zwaan C, Bär FW, Wellens HJ. Value of the electrocardiogram in diagnosing the number of severely narrowed coronary arteries in rest angina pectoris. Am J Cardiol1993; 72:999–1003.
Glancy DL. Electrocardiographic diagnosis of acute myocardial infarction. J La State Med Soc2002; 154:66–75.
Yamaji H, Iwasaki K, Kusachi S, et al. Prediction of acute left main coronary artery obstruction by 12-lead electrocardiography. ST segment elevation in lead aVR with less ST segment elevation in lead V(1). J Am Coll Cardiol2001; 38:1348–1354.
de Zwaan C, Bär FW, Wellens HJ. Characteristic electrocardiographic pattern indicating a critical stenosis high in left anterior descending coronary artery in patients admitted because of impending myocardial infarction. Am Heart J1982; 103:730–736.
de Zwaan C, Bär FW, Janssen JH, et al. Angiographic and clinical characteristics of patients with unstable angina showing an ECG pattern indicating critical narrowing of the proximal LAD coronary artery. Am Heart J1989; 117:657–665.
Lilaonitkul M, Robinson K, Roberts M. Wellens’ syndrome: significance of ECG pattern recognition in the emergency department. Emerg Med J2009; 26:750–751.
Glancy DL, Khuri B, Cospolich B. Heed the warning: Wellens’ type T-wave inversion is caused by proximal left anterior descending lesion. Proc (Bayl Univ Med Cent)2000; 13:416–418.
Savonitto S, Ardissino D, Granger CB, et al. Prognostic value of the admission electrocardiogram in acute coronary syndromes. JAMA1999; 281:707–713.
Mueller C, Neumann FJ, Perach W, Perruchoud AP, Buettner HJ. Prognostic value of the admission electrocardiogram in patients with unstable angina/non-ST-segment elevation myocardial infarction treated with very early revascularization. Am J Med2004; 117:145–150.
Boden WE, Spodick DH. Diagnostic significance of precordial ST-segment depression. Am J Cardiol1989; 63:358–361.
Shah A, Wagner GS, Green CL, et al. Electrocardiographic differentiation of the ST-segment depression of acute myocardial injury due to the left circumflex artery occlusion from that of myocardial ischemia of nonocclusive etiologies. Am J Cardiol1997; 80:512–513.
Krishnaswamy A, Lincoff AM, Menon V. Magnitude and consequences of missing the acute infarct-related circumflex artery. Am Heart J2009; 158:706–712.
Matetzky S, Freimark D, Feinberg MS, et al. Acute myocardial infarction with isolated ST-segment elevation in posterior chest leads V7-9: “hidden” ST-segment elevations revealing acute posterior infarction. J Am Coll Cardiol1999; 34:748–753.
Matetzky S, Freimark D, Chouraqui P, et al. Significance of ST segment elevations in posterior chest leads (V7 to V9) in patients with acute inferior myocardial infarction: application for thrombolytic therapy. J Am Coll Cardiol1998; 31:506–511.
Huey BL, Beller GA, Kaiser DL, Gibson RS. A comprehensive analysis of myocardial infarction due to left circumflex artery occlusion: comparison with infarction due to right coronary artery and left anterior descending artery occlusion. J Am Coll Cardiol1988; 12:1156–1166.
Gibson CM, Pride YB, Mohanavelu S, Wiviott SD, Antman EM, Braunwald E. Abstract 1999: Angiographic and clinical outcomes among patients with acute coronary syndrome presenting with isolated anterior ST-segment depressions. Circulation2008; 118:S–654.
Ferrari E, Imbert A, Chevalier T, Mihoubi A, Morand P, Baudouy M. The ECG in pulmonary embolism. Predictive value of negative T waves in precordial leads—80 case reports. Chest1997; 111:537–543.
Sreeram N, Cheriex EC, Smeets JL, Gorgels AP, Wellens HJ. Value of the 12-lead electrocardiogram at hospital admission in the diagnosis of pulmonary embolism. Am J Cardiol1994; 73:298–303.
Stein PD, Terrin ML, Hales CA, et al. Clinical, laboratory, roentgenographic, and electrocardiographic findings in patients with acute pulmonary embolism and no pre-existing cardiac or pulmonary disease. Chest1991; 100:598–603.
Norell MS, Lyons JP, Gardener JE, Layton CA, Balcon R. Significance of “reciprocal” ST segment depression: left ventriculographic observations during left anterior descending coronary angioplasty. J Am Coll Cardiol1989; 13:1270–1274.
Haraphongse M, Tanomsup S, Jugdutt BI. Inferior ST segment depression during acute anterior myocardial infarction: clinical and angiographic correlations. J Am Coll Cardiol1984; 4:467–476.
Wagner GS, Macfarlane P, Wellens H, et al; American Heart Association Electrocardiography and Arrhythmias Committee, Council on Clinical Cardiology; American College of Cardiology Foundation; Heart Rhythm Society. AHA/ACCF/HRS recommendations for the standardization and interpretation of the electrocardiogram: part VI: acute ischemia/infarction: a scientific statement from the American Heart Association Electrocardiography and Arrhythmias Committee, Council on Clinical Cardiology; the American College of Cardiology Foundation; and the Heart Rhythm Society. Endorsed by the International Society for Computerized Electrocardiology. J Am Coll Cardiol2009; 53:1003–1011.
Brady WJ, Perron AD, Syverud SA, et al. Reciprocal ST segment depression: impact on the electrocardiographic diagnosis of ST segment elevation acute myocardial infarction. Am J Emerg Med2002; 20:35–38.
Surawicz B. Electrolytes and the electrocardiogram. Postgrad Med1974; 55:123–129.
Glancy DL, Wang WL. ECG of the month. Abnormal electrocardiogram in a woman with a urinary tract infection. Sinus rhythm, rate 82/minute. Sagging ST segments, low T waves, and prominent U waves suggest hypokalemia. J La State Med Soc2007; 159:5–7.
Surawicz B, Braun HA, Crum WB, Kemp RL, Wagner S, Bellet S. Quantitative analysis of the electrocardiographic pattern of hypopotassemia. Circulation1957; 16:750–763.
Glancy DL, Rochon BJ, Ilie CC, Parker JM, Jones MB, Atluri P. Global T-wave inversion in a 77-year-old woman. Proc (Bayl Univ Med Cent)2009; 22:81–82.
Walder LA, Spodick DH. Global T wave inversion. J Am Coll Cardiol1991; 17:1479–1485.
Lui CY. Acute pulmonary embolism as the cause of global T wave inversion and QT prolongation. A case report. J Electrocardiol1993; 26:91–95.
Walder LA, Spodick DH. Global T wave inversion: long-term followup. J Am Coll Cardiol1993; 21:1652–1656.
Bybee KA, Kara T, Prasad A, et al. Systematic review: transient left ventricular apical ballooning: a syndrome that mimics ST-segment elevation myocardial infarction. Ann Intern Med2004; 141:858–865.
Wittstein IS, Thiemann DR, Lima JA, et al. Neurohumoral features of myocardial stunning due to sudden emotional stress. N Engl J Med2005; 352:539–548.
Spodick DH. Electrocardiogram in acute pericarditis. Distributions of morphologic and axial changes by stages. Am J Cardiol1974; 33:470–474.
Magnani JW, Dec GW. Myocarditis: current trends in diagnosis and treatment. Circulation2006; 113:876–890.
Rosenbaum MB, Blanco HH, Elizari MV, Lázzari JO, Davidenko JM. Electrotonic modulation of the T wave and cardiac memory. Am J Cardiol1982; 50:213–222.
Paparella N, Ouyang F, Fuca G, Kuck KH, Cappato R, Alboni P. Significance of newly acquired negative T waves after interruption of paroxysmal reentrant supraventricular tachycardia with narrow QRS complex. Am J Cardiol2000; 85:261–263.
Kaid KA, Maqsood A, Cohen M, Rothfeld E. Further characterization of the “persistent juvenile T-wave pattern” in adults. J Electrocardiol2008; 41:644–645.
Elias B. Hanna, MD Cardiovascular Department, Louisiana State University Health Sciences Center, New Orleans
David Luke Glancy, MD Cardiovascular Department, Louisiana State University Health Sciences Center, New Orleans
Address: Elias B. Hanna, MD, Internal Medicine Department, Cardiovascular Section, Louisiana State University, 1542 Tulane Avenue, Room 323, New Orleans, LA, 70123. e-mail ehanna@lsuhsc.edu
Author and Disclosure Information
Elias B. Hanna, MD Cardiovascular Department, Louisiana State University Health Sciences Center, New Orleans
David Luke Glancy, MD Cardiovascular Department, Louisiana State University Health Sciences Center, New Orleans
Address: Elias B. Hanna, MD, Internal Medicine Department, Cardiovascular Section, Louisiana State University, 1542 Tulane Avenue, Room 323, New Orleans, LA, 70123. e-mail ehanna@lsuhsc.edu
Depression of the ST segment and inversion of the T wave are common electrocardiographic abnormalities. Knowing the various ischemic and nonischemic morphologic features is critical for a timely diagnosis of high-risk myocardial ischemia and electrolyte- or drug-related abnormalities. Moreover, it is important to recognize that true posterior infarction or subtle ST-segment elevation infarction may masquerade as ST-segment depression ischemia, and that pulmonary embolism may masquerade as anterior ischemia. These common electrocardiographic abnormalities are summarized in Table 1.
THE ST SEGMENT AND THE T WAVE: A PRIMER
Abnormalities of the ST segment and the T wave represent abnormalities of ventricular repolarization.
The ST segment corresponds to the plateau phase of ventricular repolarization (phase 2 of the action potential), while the T wave corresponds to the phase of rapid ventricular repolarization (phase 3). ST-segment or T-wave changes may be secondary to abnormalities of depolarization, ie, pre-excitation or abnormalities of QRS voltage or duration.
On the other hand, ST-segment and T-wave abnormalities may be unrelated to any QRS abnormality, in which case they are called primary repolarization abnormalities. These are caused by ischemia, pericarditis, myocarditis, drugs (digoxin, antiarrhythmic drugs), and electrolyte abnormalities, particularly potassium abnormalities.
ST-segment deviation is usually measured at its junction with the end of the QRS complex, ie, the J point, and is referenced against the TP or PR segment.1 But some prefer to measure the magnitude of the ST-segment deviation 40 to 80 ms after the J point, when all myocardial fibers are expected to have reached the same level of membrane potential and to form an isoelectric ST segment; at the very onset of repolarization, small differences in membrane potential may normally be seen and may cause deviation of the J point and of the early portion of the ST segment.2
Although a diagnosis of ST-segment elevation myocardial infarction (STEMI) that mandates emergency reperfusion therapy requires ST-segment elevation greater than 1 mm in at least two contiguous leads,3 any ST-segment depression or elevation (≥ 0.5 mm, using the usual standard of 1.0 mV = 10 mm) may be abnormal, particularly when the clinical context or the shape of the ST segment suggests ischemia, or when other ischemic signs such as T-wave abnormalities, Q waves, or reciprocal ST-segment changes are concomitantly present. On the other hand, ST-segment depression of up to 0.5 mm in leads V2 and V3 and 1 mm in the other leads may be normal.1
In adults, the T wave normally is inverted in lead aVR; is upright or inverted in leads aVL, III, and V1; and is upright in leads I, II, aVF, and V2 through V6. The T wave is considered inverted when it is deeper than 1 mm; it is considered flat when its peak amplitude is between 1.0 mm and −1.0 mm.1
As we will discuss, certain features allow the various causes of ST-segment and T-wave abnormalities to be distinguished from one another.
SECONDARY ST-SEGMENT AND T-WAVE ABNORMALITIES
Modified with permission from Hanna EB, Quintal R, Jain N. Cardiology: Handbook for Clinicians. Arlington, VA: Scrubhill Press; 2009:328–354.
Figure 1. ST-segment and T-wave morphologies in cases of secondary abnormalities (A) and ischemic abnormalities (B–E).In secondary ST-segment or T-wave abnormalities, QRS criteria for left or right ventricular hypertrophy or left or right bundle branch block or pre-excitation are usually present, and the ST segment and T wave have all of the following morphologic features (Figure 1A):
The ST segment and T wave are directed opposite to the QRS: this is called discordance between the QRS complex and the ST-T abnormalities. In the case of right bundle branch block, the ST and T are directed opposite to the terminal portion of the QRS, ie, the part of the QRS deformed by the conduction abnormality.
The ST segment and T wave are both abnormal and deviate in the same direction, ie, the ST segment is down-sloping and the T wave is inverted in leads with an upright QRS complex, which gives the ST-T complex a “reverse checkmark” asymmetric morphology.
The ST and T abnormalities are not dynamic, ie, they do not change in the course of several hours to several days.
Figure 2. Example of left ventricular hypertrophy with typical secondary ST-T abnormalities in leads I, II, aVL, V4, V5, and V6. The QRS complex is upright in these leads while the ST segment and T wave are directed in the opposite direction, ie, the QRS and the ST-T complexes are discordant.
Thus, in cases of left ventricular hypertrophy or left bundle branch block, since the QRS complex is upright in the left lateral leads I, aVL, V5, and V6, the ST segment is characteristically depressed and the T wave is inverted in these leads (Figure 2). In cases of right ventricular hypertrophy or right bundle branch block, T waves are characteristically inverted in the right precordial leads V1, V2, and V3.
Left bundle branch block is always associated with secondary ST-T abnormalities, the absence of which suggests associated ischemia. Left and right ventricular hypertrophy, on the other hand, are not always associated with ST-T abnormalities, but when these are present, they correlate with more severe hypertrophy or ventricular systolic dysfunction,4 and have been called strain pattern. In addition, while these morphologic features are consistent with secondary abnormalities, they do not rule out ischemia in a patient with angina.
Some exceptions to these typical morphologic features:
Right ventricular hypertrophy and right bundle branch block may be associated with isolated T-wave inversion without ST-segment depression in precordial leads V1, V2, and V3.
Left ventricular hypertrophy may be associated with symmetric T-wave inversion without ST-segment depression or with a horizontally depressed ST segment. This may be the case in up to one-third of ST-T abnormalities secondary to left ventricular hypertrophy and is seen in hypertrophic cardiomyopathy, particularly the apical variant, in leads V3 through V6.5
ISCHEMIC ST-SEGMENT DEPRESSION, T-WAVE INVERSION, OR BOTH
ST-segment depression or T-wave inversion is consistent with ischemia if any of the following is true:
The ST-segment depression or T-wave inversion is directed in the same direction as the QRS complex: this is called concordance between the QRS complex and the ST or T abnormality (Figure 1B).
The ST segment is depressed but the T wave is upright (Figure 1C).
The T wave has a positive-negative biphasic pattern (Figure 1D).
The T wave is symmetrically inverted and has a pointed configuration, while the ST segment is not deviated or is upwardly bowed (coved) or horizontally depressed (Figure 1E).
The magnitude of ST-segment depression progresses or regresses on serial tracings, or ST-segment depression progresses to T-wave abnormality during ischemia-free intervals (dynamic ST-segment depression).
Figure 3. Electrocardiogram of a patient with angina at rest and elevated cardiac biomarkers. ST-segment depression in nine leads with elevation in leads aVR and V1 suggested subendocardial ischemia related to three-vessel or left main coronary artery disease. He had severe three-vessel disease on coronary arteriography.
Unlike ST-segment elevation, ST-segment depression does not localize ischemia.6 However, the extent and the magnitude of ST-segment depression correlate with the extent and the severity of ischemia. In fact, ST-segment depression in eight or more leads, combined with ST-segment elevation in leads aVR and V1 and occurring during ischemic pain, is associated with a 75% predictive accuracy for left main coronary artery or three-vessel disease (Figure 3).7,8 This finding may also be seen in cases of tight proximal stenosis of the left anterior descending coronary artery.9
Wellens syndrome
Figure 4. (A) Wellens-type biphasic T wave in leads V2 and V3 (arrows) and T-wave inversion in leads V4 and V5. (B) Wellens-type deep T-wave inversion in leads V2 to V4. Each patient had a 90% proximal left anterior descending stenosis at coronary arteriography.Either the positive-negative biphasic T waves of the type shown in Figure 1D or the deeply inverted (≥ 5 mm) T waves that often follow them, when occurring in the precordial leads V2 and V3, with or without similar changes in V1, V4, and V5, are nearly pathognomonic of very recent severe ischemia or injury in the distribution of the left anterior descending artery and characterize what is known as Wellens syndrome (Figure 4).10–13
Wellens and his colleagues showed that 75% of patients who developed these T-wave abnormalities and who were treated medically without angiographic investigation went on to develop extensive anterior wall myocardial infarction within a mean of 8.5 days.10
In a later investigation of 1,260 patients presenting with unstable angina, 180 patients (14%) had this characteristic T-wave pattern.11 All of the latter patients had stenosis of 50% or more in the proximal left anterior descending artery, and 18% had total occlusion of the left anterior descending artery.
Thus, although medical management may provide symptomatic improvement at first, early coronary angiography and revascularization should be strongly considered in anyone with Wellens syndrome because it usually predicts impending anterior myocardial infarction.
Wellens syndrome is characterized by two patterns of T-wave changes. In 75% of cases, T waves are deeply (≥ 5 mm) and symmetrically inverted in leads V2 through V4 (Figures 1E, 4B). In 25% of cases, the T wave has a characteristic positive-negative biphasic morphology in leads V2 through V4 (Figures 1D, 4A).10 In both patterns, the ST segment is isoelectric or minimally elevated (< 1 mm) with a straight or convex morphology, the down-slope of the T wave is sharp, and the QT interval is often prolonged. These abnormalities are characteristically seen hours to days after the ischemic chest pain resolves. In fact, the ischemic episode is usually associated with transient ST-segment elevation or depression that progresses to the T-wave abnormality after the pain subsides.11
In Wellens’ original description, only 12% of patients had increases in their creatine kinase levels, and these were small. Therefore, the electrocardiogram may be the only indication of an impending large anterior infarction in a chest-pain-free patient.12
T waves that are symmetrically but less deeply inverted than Wellens-type T waves may still represent ischemia. However, this finding is less specific for ischemia and is associated with better outcomes than Wellens syndrome or ST-segment deviation, particularly when the T wave is less than 3 mm deep.14 In fact, one prospective cohort study found that isolated mild T-wave inversion in patients presenting with acute coronary syndrome is associated with a favorable long-term outcome, similar to that in patients with no electrocardiographic changes.15
FREQUENTLY MISSED DIAGNOSES MANIFESTING AS ST-SEGMENT DEPRESSION OR T-WAVE INVERSION
When accompanied by inferior STEMI, posterior infarction is easily recognized, but it can be difficult to diagnose when it occurs alone, the so-called true posterior STEMI.
Figure 5. (A) ST-segment depression in the precordial leads V1–V4, with a maximal depression in lead V3, in a patient with severe ongoing chest pain for the preceding 3 hours. This suggests a posterior ST-segment elevation myocardial infarction. There is also a subtle ST-segment elevation in lead III, which further alludes to the diagnosis of inferoposterior infarction. Emergency coronary arteriography showed a totally occluded mid-left circumflex coronary artery. (B) The ST segment is depressed in leads V1 through V6 and leads II, III, and aVF, with a maximal depression in leads V2 and V3. In addition, tall R waves are seen in leads V1 and V2 and Q waves are seen in the lateral leads I and aVL accompanied by ST elevation in aVL. In a patient with severe persistent chest pain, this suggests a posterolateral infarct. Coronary arteriography showed a totally occluded second obtuse marginal branch.ST-segment depression that is most prominent in leads V1 through V3 often indicates posterior STEMI rather than non–ST-segment elevation ischemia and indicates the need for emergency revascularization. In fact, in the setting of posterior infarction, leads V1, V2, and V3 predominate as the areas of maximum depression, whereas greater ST-segment depression in the lateral precordial leads (V4, V5, and V6) or inferior leads (II, III, and aVF) is more indicative of nonocclusive and nonregional subendocardial ischemia (Figure 5).8,16–18
In most cases of posterior infarction, the posterior chest leads V7, V8, and V9 reveal ST-segment elevation.19 One study found that ST-segment depression in the anterior precordial leads was as sensitive as ST-segment elevation in leads V7 through V9 in identifying posterior myocardial infarction (sensitivity 80%),20 while other studies found that ST-segment deviation on standard 12-lead electrocardiography has a lower sensitivity (about 60%) in identifying posterior infarction.18,21
Tall or wide (≥ 0.04-s) R waves in leads V1 or V2, particularly when associated with upright T waves, suggest posterior infarction and may further corroborate this diagnosis, but this finding may take up to 24 hours to manifest and is seen in only about 50% of patients with posterior infarction.21
Studies have shown that ST-segment elevation on standard 12-lead electrocardiography is found in fewer than 50% of patients with acute left circumflex occlusion and inferoposterior infarction,18 yet these are cases of “missed” STEMI that indeed benefit from emergency angiography and reperfusion. In addition, studies of non–ST-segment elevation acute coronary syndrome consistently identify patients who have epicardial vessel occlusion (about 15%–20% of cases),18 yet their initial angiography is usually delayed for hours or days after the initial presentation.
A subgroup analysis from TRITON–TIMI 38 (Trial to Assess Improvement in Therapeutic Outcomes by Optimizing Platelet Inhibition With Prasugrel Thrombolysis in Myocardial Infarction 38) evaluated patients with isolated anterior ST-segment depression. An occluded “culprit” artery was found 26% of the time, most often the left circumflex artery. Moreover, those patients had a significantly higher rate of death or myocardial infarction at 30-day follow-up than patients without a culprit artery, probably related to delayed revascularization.22
Recognizing that ST-segment depression that is greatest in leads V1, V2, or V3 represents posterior infarction helps identify a portion of the missed STEMIs in a timely fashion. In addition, in cases of anterior ST-segment depression and in cases of chest pain with nondiagnostic electrocardiography, the recording of ST elevation in leads V7, V8, and V9 is highly sensitive for detecting a true posterior injury.
Acute pulmonary embolism
An anterior ischemic pattern of symmetric T-wave inversion in the precordial leads V1 through V4 may also be a sign of acute or chronic right ventricular strain, particularly acute pulmonary embolism. Sinus tachycardia is usually present, but other signs of pulmonary embolism, such as right ventricular hypertrophy and right bundle branch block, may be absent. In fact, T-wave inversion in leads V1 through V4 is noted in 19% of patients with nonmassive pulmonary embolism and in 85% of patients with massive pulmonary embolism, and is the most sensitive and specific electrocardiographic finding in massive pulmonary embolism.23
In addition, acute pulmonary embolism may be associated with T-wave inversion in leads III and aVF,24 and changes of concomitant anterior and inferior ischemia should always raise the question of this diagnosis.
In one retrospective study of patients with acute pulmonary embolism, nonspecific ST-segment or T-wave changes were the most common finding on electrocardiography, noted in 49%.25 Rapid regression of these changes on serial tracings favors pulmonary embolism rather than myocardial infarction.
ST-segment depression reciprocal to a subtle ST-segment elevation
When ST-segment elevation occurs in two contiguous standard leads while ST-segment depression occurs in other leads, and when the ST-segment and T-wave abnormalities are ischemic rather than secondary to depolarization abnormalities, ST-segment elevation is considered the primary ischemic abnormality whereas ST-segment depression is often considered a reciprocal “mirror image” change. This “reciprocal” change may also represent remote ischemia in a distant territory in patients with multivessel coronary disease.26,27
Reciprocal ST-segment depression is present in all patients with inferior myocardial infarction and in 70% of patients with anterior myocardial infarction.28
Figure 6. Example of subtle ST-segment elevation in two contiguous leads with a prominent ST-segment depression in other leads. The ST segment is depressed in leads I and aVL and V4, V5, and V6. There is a subtle ST-segment elevation with a broad hyperacute T wave in leads III and aVF fused with the ST segment in a convex fashion (arrows), suggesting that the primary abnormality is actually an acute inferior injury. Coronary arteriography showed a totally occluded right coronary artery in its mid-segment and severe left circumflex disease. The ST-segment depression is partly reciprocal to the inferior injury and partly a reflection of left circumflex-related ischemia.However, it is important to recognize that the magnitude of ST-segment elevation and reciprocal ST-segment depression is affected by the distance of the leads recording these changes from the ischemic region and their angle of deviation from the ischemic region.29 This explains why occasionally—and particularly when the overall amplitude of the QRS complex is low—the magnitude of ST-segment elevation is small, whereas the reciprocal ST-segment depression is more prominent. In fact, in the absence of left ventricular hypertrophy or left bundle branch block, the reciprocal ST-segment depression should be sought. It is of great utility in patients with acute cardiac symptoms and mild elevation of ST segments of 1 to 1.5 mm in two contiguous leads, as it strongly suggests the diagnosis of STEMI rather than other causes of mild ST-segment elevation (1–1.5 mm) (Figure 6).30 The less-pronounced ST-segment elevation is often overlooked, and the patient is erroneously diagnosed with non–ST-segment elevation acute coronary syndrome rather than STEMI. This has a marked impact on patient management, as STEMI requires emergency revascularization, while non–ST-segment elevation ischemia requires early (but not emergency) coronary angiography.
Hypokalemia and digitalis effect
Figure 7. (A) Note the progressive flattening of the T wave, increase in U wave amplitude, and depression of the ST segment with progressive levels of hypokalemia (serum potassium levels are expressed in mEq/L). (B) Electrocardiogram of a patient with a serum potassium level of 2.8 mEq/L. Note the flattened T waves (bars) and the prominent U waves (arrows).ST-segment depression, T-wave flattening, and prominent U waves are the hallmarks of hypokalemia and can be mistaken for ischemic changes, including ischemic lengthening of the QT interval (Figure 7).31–34 Digitalis also produces ST-segment depression, low or inverted T waves, and prominent U waves, but the U waves rarely are of the giant variety seen with severe hypokalemia, and the ST-segment depression has a sagging shape. In addition, digitalis shortens the QT interval.
DIFFUSE (GLOBAL) T-WAVE INVERSION
Reproduced with permission from Glancy DL, et al. Global T-wave inversion in a 77-year-old woman. Proc (Bayl Univ Med Cent) 2009; 22:81–82.
Figure 8. Global T-wave inversion with marked QT prolongation in a 77-year-old woman presenting with dyspnea and elevated cardiac biomarkers. Her coronary arteriography showed a 90% distal left main stenosis extending into the proximal left anterior descending and left circumflex coronary arteries.This term is applied when the T wave is inverted in most of the standard leads except aVR, which shows a reciprocal upright T wave. The QT interval is often prolonged, and T-wave inversion is often symmetric and “giant” (> 10 mm) (Figure 8).1,35
Walder and Spodick36 have found this pattern to be caused most often by myocardial ischemia or neurologic events, particularly intracranial hemorrhage, and it seems more prevalent in women. Other causes include hypertrophic cardiomyopathy, stress-induced cardiomyopathy (takotsubo cardiomyopathy), cocaine abuse, pericarditis, pulmonary embolism, and advanced or complete atrioventricular block.36,37
The prognosis in patients with global T-wave inversion is determined by the underlying disease, and the striking T-wave changes per se do not imply a poor prognosis.38
Figure 9. (A) Persistent juvenile T-wave pattern in a 40-year-old woman with T-wave inversion extending from lead V1 to lead V4. The depth of the inverted T waves decreases between V1 and V4. Also, the T wave progressively becomes less deeply inverted as the patient ages. (B) Normal variant terminal T-wave inversion with ST-segment elevation in leads V2 through V5 in a 21-year-old black man. This pattern is most often seen in young black men, a few of whom at other times manifest the typical early repolarization pattern. The age and clinical presentation distinguish this pattern from Wellens-type T waves.Of note, takotsubo cardiomyopathy is characterized by electrocardiographic changes that mimic ischemia, especially STEMI, and is often impossible to differentiate from myocardial ischemia related to a coronary event without performing coronary arteriography. The most common abnormality on the admission electrocardiogram is ST-segment elevation (present in 46%–100% of patients), typically seen in the precordial leads. Within 48 hours of presentation, almost all patients also develop postischemic diffuse T-wave inversion and prolongation of the QT interval. New Q waves may be seen in 6% to 31% of patients and are usually transient.39,40
OTHER CAUSES OF T-WAVE INVERSION OR ST-SEGMENT DEPRESSION
Various other entities may cause T-wave inversion, notably acute pericarditis or myocarditis, 41,42 memory T-wave phenomenon,43,44 and normal variants of repolarization (Table 1, Figure 9).45 Additionally, a nonpathologic junctional ST-segment depression may be seen in tachycardia (Figure 10).
Figure 10. (A) Up-sloping ST-segment depression in a case of sinus tachycardia. This is related to the exaggerated atrial repolarization that occurs during tachycardia and depresses the PR segment and the initial portion of the ST-segment when compared with the TP segment. (B) Electrocardiogram of a patient with sinus tachycardia and junctional ST-segment depression in leads II and V4 through V6. It has no pathologic significance.
References
Rautaharju PM, Surawicz B, Gettes LS, et al; American Heart Association Electrocardiography and Arrhythmias Committee, Council on Clinical Cardiology; American College of Cardiology Foundation; Heart Rhythm Society. AHA/ACCF/HRS recommendations for the standardization and interpretation of the electrocardiogram: part IV: the ST segment, T and U waves, and the QT interval: a scientific statement from the American Heart Association Electrocardiography and Arrhythmias Committee, Council on Clinical Cardiology; the American College of Cardiology Foundation; and the Heart Rhythm Society. Endorsed by the International Society for Computerized Electrocardiology. J Am Coll Cardiol2009; 53:982–991.
Antman EM, Anbe DT, Armstrong PW, et al. ACC/AHA guidelines for the management of patients with ST-elevation myocardial infarction; A report of the American College of Cardiology/American Heart Association Task Force on Practice Guidelines (Committee to Revise the 1999 Guidelines for the Management of patients with acute myocardial infarction). J Am Coll Cardiol2004; 44:E1–E211.
Okin PM, Devereux RB, Nieminen MS, et al; LIFE Study Investigators. Electrocardiographic strain pattern and prediction of new-onset congestive heart failure in hypertensive patients: the Losartan Intervention for Endpoint Reduction in Hypertension (LIFE) study. Circulation2006; 113:67–73.
Huwez FU, Pringle SD, Macfarlane PW. Variable patterns of ST-T abnormalities in patients with left ventricular hypertrophy and normal coronary arteries. Br Heart J1992; 67:304–307.
Li D, Li CY, Yong AC, Kilpatrick D. Source of electrocardiographic ST changes in subendocardial ischemia. Circ Res1998; 82:957–970.
Gorgels AP, Vos MA, Mulleneers R, de Zwaan C, Bär FW, Wellens HJ. Value of the electrocardiogram in diagnosing the number of severely narrowed coronary arteries in rest angina pectoris. Am J Cardiol1993; 72:999–1003.
Glancy DL. Electrocardiographic diagnosis of acute myocardial infarction. J La State Med Soc2002; 154:66–75.
Yamaji H, Iwasaki K, Kusachi S, et al. Prediction of acute left main coronary artery obstruction by 12-lead electrocardiography. ST segment elevation in lead aVR with less ST segment elevation in lead V(1). J Am Coll Cardiol2001; 38:1348–1354.
de Zwaan C, Bär FW, Wellens HJ. Characteristic electrocardiographic pattern indicating a critical stenosis high in left anterior descending coronary artery in patients admitted because of impending myocardial infarction. Am Heart J1982; 103:730–736.
de Zwaan C, Bär FW, Janssen JH, et al. Angiographic and clinical characteristics of patients with unstable angina showing an ECG pattern indicating critical narrowing of the proximal LAD coronary artery. Am Heart J1989; 117:657–665.
Lilaonitkul M, Robinson K, Roberts M. Wellens’ syndrome: significance of ECG pattern recognition in the emergency department. Emerg Med J2009; 26:750–751.
Glancy DL, Khuri B, Cospolich B. Heed the warning: Wellens’ type T-wave inversion is caused by proximal left anterior descending lesion. Proc (Bayl Univ Med Cent)2000; 13:416–418.
Savonitto S, Ardissino D, Granger CB, et al. Prognostic value of the admission electrocardiogram in acute coronary syndromes. JAMA1999; 281:707–713.
Mueller C, Neumann FJ, Perach W, Perruchoud AP, Buettner HJ. Prognostic value of the admission electrocardiogram in patients with unstable angina/non-ST-segment elevation myocardial infarction treated with very early revascularization. Am J Med2004; 117:145–150.
Boden WE, Spodick DH. Diagnostic significance of precordial ST-segment depression. Am J Cardiol1989; 63:358–361.
Shah A, Wagner GS, Green CL, et al. Electrocardiographic differentiation of the ST-segment depression of acute myocardial injury due to the left circumflex artery occlusion from that of myocardial ischemia of nonocclusive etiologies. Am J Cardiol1997; 80:512–513.
Krishnaswamy A, Lincoff AM, Menon V. Magnitude and consequences of missing the acute infarct-related circumflex artery. Am Heart J2009; 158:706–712.
Matetzky S, Freimark D, Feinberg MS, et al. Acute myocardial infarction with isolated ST-segment elevation in posterior chest leads V7-9: “hidden” ST-segment elevations revealing acute posterior infarction. J Am Coll Cardiol1999; 34:748–753.
Matetzky S, Freimark D, Chouraqui P, et al. Significance of ST segment elevations in posterior chest leads (V7 to V9) in patients with acute inferior myocardial infarction: application for thrombolytic therapy. J Am Coll Cardiol1998; 31:506–511.
Huey BL, Beller GA, Kaiser DL, Gibson RS. A comprehensive analysis of myocardial infarction due to left circumflex artery occlusion: comparison with infarction due to right coronary artery and left anterior descending artery occlusion. J Am Coll Cardiol1988; 12:1156–1166.
Gibson CM, Pride YB, Mohanavelu S, Wiviott SD, Antman EM, Braunwald E. Abstract 1999: Angiographic and clinical outcomes among patients with acute coronary syndrome presenting with isolated anterior ST-segment depressions. Circulation2008; 118:S–654.
Ferrari E, Imbert A, Chevalier T, Mihoubi A, Morand P, Baudouy M. The ECG in pulmonary embolism. Predictive value of negative T waves in precordial leads—80 case reports. Chest1997; 111:537–543.
Sreeram N, Cheriex EC, Smeets JL, Gorgels AP, Wellens HJ. Value of the 12-lead electrocardiogram at hospital admission in the diagnosis of pulmonary embolism. Am J Cardiol1994; 73:298–303.
Stein PD, Terrin ML, Hales CA, et al. Clinical, laboratory, roentgenographic, and electrocardiographic findings in patients with acute pulmonary embolism and no pre-existing cardiac or pulmonary disease. Chest1991; 100:598–603.
Norell MS, Lyons JP, Gardener JE, Layton CA, Balcon R. Significance of “reciprocal” ST segment depression: left ventriculographic observations during left anterior descending coronary angioplasty. J Am Coll Cardiol1989; 13:1270–1274.
Haraphongse M, Tanomsup S, Jugdutt BI. Inferior ST segment depression during acute anterior myocardial infarction: clinical and angiographic correlations. J Am Coll Cardiol1984; 4:467–476.
Wagner GS, Macfarlane P, Wellens H, et al; American Heart Association Electrocardiography and Arrhythmias Committee, Council on Clinical Cardiology; American College of Cardiology Foundation; Heart Rhythm Society. AHA/ACCF/HRS recommendations for the standardization and interpretation of the electrocardiogram: part VI: acute ischemia/infarction: a scientific statement from the American Heart Association Electrocardiography and Arrhythmias Committee, Council on Clinical Cardiology; the American College of Cardiology Foundation; and the Heart Rhythm Society. Endorsed by the International Society for Computerized Electrocardiology. J Am Coll Cardiol2009; 53:1003–1011.
Brady WJ, Perron AD, Syverud SA, et al. Reciprocal ST segment depression: impact on the electrocardiographic diagnosis of ST segment elevation acute myocardial infarction. Am J Emerg Med2002; 20:35–38.
Surawicz B. Electrolytes and the electrocardiogram. Postgrad Med1974; 55:123–129.
Glancy DL, Wang WL. ECG of the month. Abnormal electrocardiogram in a woman with a urinary tract infection. Sinus rhythm, rate 82/minute. Sagging ST segments, low T waves, and prominent U waves suggest hypokalemia. J La State Med Soc2007; 159:5–7.
Surawicz B, Braun HA, Crum WB, Kemp RL, Wagner S, Bellet S. Quantitative analysis of the electrocardiographic pattern of hypopotassemia. Circulation1957; 16:750–763.
Glancy DL, Rochon BJ, Ilie CC, Parker JM, Jones MB, Atluri P. Global T-wave inversion in a 77-year-old woman. Proc (Bayl Univ Med Cent)2009; 22:81–82.
Walder LA, Spodick DH. Global T wave inversion. J Am Coll Cardiol1991; 17:1479–1485.
Lui CY. Acute pulmonary embolism as the cause of global T wave inversion and QT prolongation. A case report. J Electrocardiol1993; 26:91–95.
Walder LA, Spodick DH. Global T wave inversion: long-term followup. J Am Coll Cardiol1993; 21:1652–1656.
Bybee KA, Kara T, Prasad A, et al. Systematic review: transient left ventricular apical ballooning: a syndrome that mimics ST-segment elevation myocardial infarction. Ann Intern Med2004; 141:858–865.
Wittstein IS, Thiemann DR, Lima JA, et al. Neurohumoral features of myocardial stunning due to sudden emotional stress. N Engl J Med2005; 352:539–548.
Spodick DH. Electrocardiogram in acute pericarditis. Distributions of morphologic and axial changes by stages. Am J Cardiol1974; 33:470–474.
Magnani JW, Dec GW. Myocarditis: current trends in diagnosis and treatment. Circulation2006; 113:876–890.
Rosenbaum MB, Blanco HH, Elizari MV, Lázzari JO, Davidenko JM. Electrotonic modulation of the T wave and cardiac memory. Am J Cardiol1982; 50:213–222.
Paparella N, Ouyang F, Fuca G, Kuck KH, Cappato R, Alboni P. Significance of newly acquired negative T waves after interruption of paroxysmal reentrant supraventricular tachycardia with narrow QRS complex. Am J Cardiol2000; 85:261–263.
Kaid KA, Maqsood A, Cohen M, Rothfeld E. Further characterization of the “persistent juvenile T-wave pattern” in adults. J Electrocardiol2008; 41:644–645.
ST-T abnormalities concordant to the QRS complex suggest ischemia.
Deep T-wave inversion or positive-negative biphasic T waves in the anterior precordial leads reflect severe left anterior descending coronary artery stenosis.
Two particular patterns of ST-segment depression reflect ST-segment elevation myocardial infarction rather than non–ST-segment elevation acute coronary syndrome: ST-segment depression that is reciprocal to a subtle and sometimes overlooked ST-segment elevation, and ST-segment depression that is maximal in leads V1–V3, suggesting true posterior infarction.
T-wave inversion in the anterior precordial leads may be seen in cases of acute pulmonary embolism, while flattened T waves with prominent U waves and ST-segment depression may reflect hypokalemia or digitalis therapy.
Disallow All Ads
Alternative CME
Consolidated Pubs: Do Not Show Source Publication Logo
Effective and rapid reperfusion is crucial in patients with acute ST-segment elevation myocardial infarction (MI). The preferred strategy for reperfusion—when it can be performed in a timely fashion at an experienced facility—is primary percutaneous coronary intervention (PCI), which produces outcomes superior to those of pharmacologic thrombolysis.1
Unfortunately, in the United States about half of patients present to hospitals that do not have PCI capability,2 and in one analysis, 91% of transferred patients had a door-to-balloon time greater than the recommended 90 minutes, with a mean of 152 minutes.3 (In this case, the door-to-balloon time was the time that elapsed between entry into the first hospital and inflation of the PCI balloon at the second hospital.)
In situations such as these, a combined approach may be appropriate, with thrombolysis delivered by paramedics or at a local facility, followed by transfer to a PCI facility and performance of PCI within a few hours. However, this is feasible only if standardized community-based or regional protocols for prompt transfer and reperfusion are in place.
In this paper we discuss the rationale and the clinical data behind several approaches to combined reperfusion, as well as experiences with community-based care protocols.
WITHIN 3 HOURS OF SYMPTOM ONSET, THROMBOLYSIS IS AS GOOD AS PCI
The PRAGUE-2 Trial
In the randomized PRAGUE-2 trial,4 patients with ST-elevation MI who presented to a non-PCI facility had better outcomes if they were transferred promptly for PCI (median door-to-balloon time 97 minutes), as opposed to receiving local therapy with streptokinase. However, for patients presenting within 3 hours of symptom onset, the mortality rates were comparable with either strategy.4
See the glossary of clinical trial names below
The CAPTIM trial
In the CAPTIM trial,5 patients who presented within 2 hours of symptom onset and who were randomized to receive prehospital thrombolysis had outcomes similar to those of patients treated with primary PCI, despite a short door-to-balloon time (82 minutes).
The Vienna STEMI Registry
In the Vienna STEMI Registry,6 the mortality rates with primary PCI and with thrombolysis were similar when patients presented within 2 hours of symptom onset. However, as the time from symptom onset increased, primary PCI appeared to offer an increasing survival benefit compared with thrombolysis.
Comments: Thrombolysis is effective mostly in the first 2 to 3 hours, with some benefit up to 12 hours
Previous studies have shown that the sooner thrombolysis is given after symptom onset, the more effective it is. If it is given within an hour of symptom onset, the relative reduction in the mortality rate is 50% and the absolute reduction is 6.5% compared with no reperfusion therapy. If it is started in the second hour, the absolute reduction in the mortality rate drops to 4%, and a lesser benefit extends to patients presenting up to 12 hours after symptom onset.7 This time-dependent benefit is due to the fact that very early reperfusion of the occluded coronary artery may lead to full recovery of ischemic tissue and thus prevent necrosis. In addition, thrombolysis in the first 2 hours is highly efficacious in lysing a fresh thrombus.
These data support the current guidelines of the American College of Cardiology (ACC) and the American Heart Association (AHA), which state no preference for either thrombolytic therapy or PCI in ST-elevation MI if the presentation is less than 3 hours after symptom onset.8
Of note, in the CAPTIM trial and in the Vienna STEMI Registry, rescue PCI was available and was in fact used after thrombolysis in about 25% of patients, which might have contributed to the benefit of early thrombolysis.
PRIMARY PCI MAY NOT BE SUPERIOR IF TRANSFER TIME IS LONG
Another time-related factor to consider is the PCI-related delay, ie, the theoretical difference between the expected time from first medical contact to balloon inflation (if the patient undergoes primary PCI) and the time from first medical contact to the start of thrombolytic therapy (if the patient undergoes primary thrombolysis).
A meta-analysis of 13 trials comparing PCI and thrombolysis showed that a PCI-related delay of more than 60 minutes might negate the potential advantage of primary PCI over immediate thrombolysis in terms of deaths.9
This observation has been further refined by data from the National Registry of Myocardial Infarction.10 In this analysis, patient factors, including age, duration of symptoms, and infarct location, significantly affected the point at which the PCI-related delay negated the survival advantage of primary PCI. The survival advantage of primary PCI was lost more rapidly—with a PCI-related delay as short as 40 minutes—in patients who presented sooner, were younger, or had anterior MI. Primary PCI maintained its survival advantage even with a PCI-related delay longer than 100 minutes in older patients or patients with nonanterior MI presenting more than 3 hours after symptom onset. Given that median door-to-balloon times in the United States may exceed 150 minutes when transfer is involved, 3 primary PCI may be no better than primary thrombolysis in transferred patients who present early or who have large infarcts.
Although these results were derived from a post hoc analysis of a registry and the delay times reported were sometimes inaccurate, they suggest that both the PCI-related delay time and patient characteristics should be considered when selecting a reperfusion strategy. Thrombolytic therapy before and in conjunction with primary PCI was considered a potential solution to these concerns.
In addition, while the benefit of any reperfusion strategy depends on the time of presentation, the loss in benefit by later presentation is less pronounced with primary PCI than with thrombolysis, making thrombolysis less attractive in later presentations (> 3 hours).11
Also, while thrombolytic therapy in patients older than 75 years was associated with a lower mortality rate compared with no therapy in a large Swedish registry,12 this benefit was less striking than in younger patients. A meta-analysis of thrombolysis trials failed to show a similar benefit in patients over age 75 vs younger patients,13 whereas primary PCI remained effective and superior to thrombolysis in the elderly, with more absolute reduction in mortality rates in the elderly subgroup than with younger patients. 14 This makes thrombolysis less attractive in the elderly, either as a stand-alone therapy or in conjunction with PCI. Studies of combined thrombolysis and PCI included very few patients over age 75.15–17
THREE COMBINATION REPERFUSION STRATEGIES
Figure 1. The timing of percutaneous coronary intervention (PCI) in relation to thrombolysis in the pharmacoinvasive strategy, rescue PCI strategy, and facilitated PCI strategy, with the respective clinical trials that addressed and defined these strategies. (See the glossary above for complete names of studies.)Three different combination reperfusion strategies for ST-elevation MI have been studied (Figure 1)15,16,18–20:
Facilitated PCI is a strategy of thrombolysis immediately followed by PCI, with a planned door-to-balloon time of 90 to 120 minutes.
Pharmacoinvasive therapy means giving thrombolysis at a non-PCI facility and then promptly and systematically transferring the patient to a PCI facility, where PCI is performed 2 to 24 hours after the start of thrombolytic therapy, regardless of whether thrombolysis results in successful reperfusion. 15 Thus, the time to PCI is longer than with facilitated PCI. Facilitated PCI addresses the value of pretreatment with thrombolytics or glycoprotein IIb/IIIa inhibitors in patients otherwise eligible for primary PCI, whereas pharmacoinvasive therapy addresses the value of routine early PCI after thrombolysis in patients who are not eligible for primary PCI.16
Rescue PCI refers to PCI that is performed urgently if thrombolysis fails, failure being defined as persistent hemodynamic or electrical instability, persistent ischemic symptoms, or failure to achieve at least a 50% to 70% resolution of the maximal ST-segment elevation 90 minutes after the infusion is started.
FACILITATED PCI: NEGATIVE RESULTS IN CLINICAL TRIALS
ASSENT-4 PCI trial
In the ASSENT-4 PCI trial,18 patients receiving full thrombolytic therapy before PCI had a higher rate of in-hospital death, bleeding, and cardiovascular events at 90 days than patients treated with primary PCI.
This trial recruited patients arriving at hospitals with or without PCI capability. The door-to-balloon time was about 110 minutes in both groups, which might not have been prolonged enough to show a benefit from a timely addition of thrombolysis. In addition, antiplatelet therapy was limited in these patients: glycoprotein IIb/IIIa inhibitors were not given, and clopidogrel (Plavix) was not appropriately preloaded, and this might have offset the potential benefit of early PCI. In fact, data suggest that platelet activation and aggregation are heightened after thrombolysis, 21–23 and that glycoprotein IIb/IIIa antagonists can inhibit these effects.23
The FINESSE trial
In the FINESSE trial,19 patients were randomized to undergo primary PCI, to undergo PCI facilitated (ie, preceded) by abciximab (Reo-Pro), or to undergo PCI facilitated by half-dose reteplase (Retavase) and full-dose abciximab. Despite a median door-to-balloon time of 132 minutes, the three strategies were associated with similar rates of death, heart failure, or ischemic outcome at 90 days. Even though the dosage of heparin was weight-adjusted, more major bleeding events occurred with the facilitated strategies.
Comments: Some subgroups may still benefit from facilitated PCI
The results of ASSENT-4 PCI and FINESSE led to the conclusion that PCI facilitated by full-dose thrombolysis should be avoided, and called into question the value of PCI facilitation using glycoprotein IIb/IIIa inhibitors with or without half-dose thrombolytic therapy.
However, subgroup analyses of these trials identified some subgroups that may benefit from a facilitated strategy. In ASSENT-4 PCI, 45% of patients were enrolled at PCI hospitals with a minimal PCI-related delay time. These patients had the worst outcome with the facilitated strategy. In contrast, patients who had a short time from pain onset to thrombolysis (2 to 3 hours) and who were given prehospital thrombolysis had a trend toward better outcomes with facilitated PCI.24 And in FINESSE, 60% of patients were enrolled at centers with PCI capability. Analysis of a small subgroup of patients with a Thrombolysis in Myocardial Infarction study (TIMI) risk score of 3 or greater presenting to non-PCI hospitals within 4 hours of symptom onset suggested a potential reduction of ischemic events with the facilitated strategy in these patients.25
Thus, for patients seen in the first 2 to 3 hours after symptom onset, immediate thrombolysis is recommended if PCI will likely be delayed, with or without plans for subsequent early PCI. “Time is muscle,” especially during the first 3 hours.
PHARMACOINVASIVE STRATEGY: GOOD RESULTS IN HIGH-RISK PATIENTS
A number of randomized studies during the last 10 years have examined the value of a pharmacoinvasive strategy.15,16,26–29
The TRANSFER-AMI trial
The TRANSFER-AMI trial15 randomized 1,059 patients with high-risk ST-elevation MI (ie, anterior or high-risk inferior) at non-PCI centers to undergo either pharmacoinvasive care, ie, full-dose tenecteplase (TNKase) with immediate transfer for PCI or standard care, ie, tenecteplase with transfer for rescue PCI if the patient had persistent ST-segment elevation, chest pain, or hemodynamic instability.15 The goal was to perform PCI within 6 hours of thrombolysis, and the median time to PCI was 3.9 hours (range 2–6 hours). In the standard-care group, 35% of patients needed to be transferred for rescue PCI. Unlike in the ASSENT-4 trial, over 80% of patients received aggressive antiplatelet therapy with both 300 mg of clopidogrel and glycoprotein IIb/IIIa inhibitors.
The rate of cardiovascular events at 30 days was significantly lower with pharmacoinvasive therapy than with standard care and rescue PCI (11% vs 17%, P = .004). This difference was driven by lower rates of recurrent ischemia, reinfarction, and heart failure.
The CARESS-in-AMI study
The CARESS-in-AMI study16 found a similar improvement in ischemic outcomes in 600 patients with high-risk ST-elevation MI arriving at non-PCI centers if they had received pharmacoinvasive therapy. Patients received half-dose reteplase and abciximab and were randomized either to be immediately transferred for PCI (median time to PCI 2.25 hours) or to be transferred only if they had persistent ST-segment elevation or clinical deterioration.16 The event rate was low with pharmacoinvasive therapy, comparable to that achieved in primary PCI trials.
Interestingly, no significant increase was seen in the risk of major and minor bleeding in these two trials despite the use of a femoral approach for PCI in over 80% of the cases; this is probably due to the delays between thrombolytic administration and PCI and to the use of a highly fibrin-specific thrombolytic agent and adjusted-dose heparin.
Meta-analysis of pharmacoinvasive trials
A meta-analysis29 of studies of systematic early PCI (mainly with stenting) within 24 hours of thrombolysis showed a reduction in the rates of mortality and reinfarction with this strategy, without an increase in the risk of major or intracranial bleeding.30 In contrast to the results of the trials of facilitated PCI, a pharmacoinvasive strategy improved outcomes in these trials because the delay between thrombolysis and PCI was more than 2 hours, ie, long enough to prevent bleeding complications, and because most patients randomized in these trials presented within 2 to 3 hours of symptom onset, when the time to reperfusion is critical. After 3 hours, the PCI-mediated myocardial salvage is less time-dependent. Moreover, trials of pharmacoinvasive strategy used aggressive antiplatelet therapy with clopidogrel and glycoprotein IIb/IIIa inhibitors.
Comment: Pharmacoinvasive strategy in the guidelines
These results and those of the subgroup analysis from the FINESSE trial suggest that patients with high-risk ST-elevation MI treated at non-PCI hospitals have better outcomes without an increase in major bleeding events when given thrombolysis and then immediately transferred for routine PCI, rather than being transferred only if reperfusion fails.
Hence, the 2009 update of the ACC/AHA guidelines31 gives a class IIa recommendation for transferring patients with anterior ST-elevation MI or high-risk inferior ST-elevation MI treated with thrombolysis to a PCI-capable facility where PCI is performed as part of a pharmacoinvasive or rescue strategy soon after thrombolysis.
This strategy has been particularly studied in patients younger than 75 years presenting with high-risk types of ST-elevation MI early (< 3 hours) after symptom onset. If not at high risk, the patient may be transferred to a PCI facility after receiving thrombolysis or observed in the initial facility (class IIb recommendation). Consideration should be given to starting anticoagulant and antiplatelet therapy before and during transfer—ie, 300 mg of clopidogrel before transfer for PCI and glycoprotein IIb/IIIa inhibitor therapy during PCI.
The European Society of Cardiology (ESC) guidelines32 recommend early routine angiography 3 to 24 hours after successful thrombolysis. This time window was selected to avoid PCI during the prothrombotic period in the first few hours after thrombolysis and to minimize the risk of reocclusion with PCI delays of more than 24 hours (class IIa recommendation).
Larger randomized trials are still needed to establish whether the pharmacoinvasive strategy confers a survival benefit, to determine its usefulness in low-risk inferior or lateral ST-elevation MI, and to further refine the time window when PCI is both safe and beneficial after thrombolysis.33
RESCUE PCI REDUCES MORTALITY RATES
Rescue PCI is the most accepted form of thrombolysis-PCI combination.
The REACT trial
The REACT trial20 showed that rescue PCI performed at a mean of 4.5 hours after failed thrombolysis reduces the rate of adverse cardiovascular events by more than 50% at 6 to 12 months and reduces the 5-year mortality rate by more than 50% compared with conservative management.20 As in the pharmacoinvasive strategy, aggressive antiplatelet regimens were used in the REACT trial.
A meta-analysis of rescue PCI trials
A meta-analysis of rescue PCI trials34 confirmed these results, showing a reduction in heart failure and reinfarction and a trend toward a lower mortality rate with rescue PCI.34 After thrombolysis, 40% of patients do not achieve grade 3 TIMI flow, which explains why in modern clinical trials 30% of patients treated with thrombolysis require rescue PCI.5,15,16,35
For patients with high-risk ST-elevation MI, current ACC/AHA guidelines assign a class IIa recommendation to rescue PCI.31
WHEN PATIENTS WITH ST-ELEVATION MI PRESENT TO A NON-PCI HOSPITAL
Transfer for primary PCI vs thrombolysis at the non-PCI hospital
The DANAMI-2 trial36 found that immediate transfer for PCI was superior to onsite thrombolytic therapy, as measured by a reduction in the rate of ischemic events (composite of death, myocardial infarction, or stroke at 30 days): 8.5% vs 14.2% (P < .001). There were no deaths during transfer.3
The PRAGUE-2 trial4 showed similar results for patients presenting 3 to 12 hours after symptom onset (30-day mortality rate 6% with immediate transfer vs 15.3% with on-site thrombolysis, P < .002), whereas patients presenting within 3 hours of symptom onset had a similar mortality rate with either therapy.4
Comment. These trials showed that transfer for primary PCI is superior to thrombolytic therapy when performed in a timely fashion. However, they were done in countries with established transfer networks and short distances between community hospitals and PCI centers, with a PCI-related delay of only 44 minutes and a door-to-balloon time of 90 minutes despite transfer. The large-scale application of this prompt transfer policy is not practical in most regions in the United States. Thus, a strategy of local thrombolysis followed by routine early transfer for routine or rescue PCI seems warranted when the door-to-balloon time or the PCI-related delay time is expected to be too long.
Experiences with community-based systems of care and prehospital thrombolysis
In Minnesota, Henry et al37 developed a PCI-based treatment system and an integrated transfer program for ST-elevation MI involving 30 hospitals within 210 miles of the Minneapolis Heart Institute. Participating hospitals were divided into two zones: zone 1 hospitals were within 60 miles, and zone 2 facilities were between 60 and 210 miles from the Heart Institute. Zone 2 patients received half-dose tenecteplase (if thrombolytic therapy was not contraindicated) in anticipation of a lengthy transfer time.
The median door-to-balloon time for zone 1 patients was 95 minutes (interquartile range 82 and 116 minutes) and for zone 2 patients 120 minutes (interquartile range 100 and 145 minutes). The diagnosis of ST-elevation MI was made by the emergency department physician, who activated the system with a phone call. The patient was then directly transferred to the catheterization laboratory, most often by helicopter.
The in-hospital death rate for patients who presented to the PCI center and for patients in zones 1 and 2 was similarly low (about 5%).37
In France, the FAST-MI registry,17 which collected outcome data for different reperfusion strategies, found that thrombolysis yielded in-hospital and midterm results that were comparable to those of primary PCI. Of note, thrombolysis was started early after symptom onset (about 2 hours), and was started in the ambulance in two-thirds of cases. Nearly all patients underwent a pharmacoinvasive strategy that combined thrombolysis with coronary angiography and PCI within 24 hours of symptom onset. These findings suggest that timely thrombolysis followed by semiurgent transfer for PCI is an alternative to primary PCI for patients presenting to hospitals with no PCI capability, and that this alternative offers similar benefit to that of primary PCI.
Five centers in the United States have reported their experience with half-dose thrombolysis in the prehospital setting (in the field or during transfer) or at a non-PCI hospital, followed by prompt transfer to a PCI facility. In this registry of almost 3,000 patients,38 patients treated with thrombolysis had better outcomes than patients directly transferred for primary PCI, with a significantly lower 30-day mortality rate (3.8% vs from 6.4%), and no increase in bleeding.38,39 The mean door-to-balloon time was long (168 minutes in the primary PCI group and 196 minutes in the thrombolysis-PCI group), which might explain the benefit achieved with prompt thrombolysis.
CARDIOGENIC SHOCK
Patients presenting with left ventricular cardiogenic shock derive a large mortality benefit from revascularization, whether they are transferred or directly admitted to a PCI center. 40 Moreover, in the SHOCK registry, patients with predominant right ventricular cardiogenic shock had an in-hospital mortality rate similar to that of patients with predominant left ventricular cardiogenic shock, and revascularization (PCI or surgical revascularization) was associated with a strikingly lower mortality rate in both groups.41
Thus, all patients with left or right cardiogenic shock should be revascularized on an emergency basis, either surgically or percutaneously.
While trials of pharmacoinvasive therapy excluded patients with cardiogenic shock,15,16 thrombolytic therapy was associated with improved outcomes in the drug-therapy group of the SHOCK trial and in hypotensive patients randomized in the early thrombolysis trials.13 Thus, the ACC/AHA guidelines recommend thrombolytic therapy before transfer if a patient presents in shock within 3 to 6 hours of onset of the MI and delays in transport and intervention are anticipated.8
PUTTING IT ALL TOGETHER: MANAGEMENT STRATEGIES
Figure 2. Selecting the appropriate reperfusion strategy in ST-elevation myocardial infarction (MI). Routine early PCI is particularly indicated in high-risk MI, ie, either anterior MI, or inferior MI with one of the following: systolic blood pressure of less than 100 mm Hg, heart rate of more than 100 beats per minute, Killip class II or III, ST-segment depression of 2 mm or more in the anterior leads, or ST-segment elevation of 1 mm or more in the right-sided lead V4, which is indicative of right ventricular involvement. Dual antiplatelet therapy with aspirin and clopidogrel (Plavix) 300 mg should be started as soon as possible in all patients, and consideration should be given to glycoprotein IIb/IIIa inhibition for most patients during PCI (as in the TRANSFER-AMI15 and CARESS-in-AMI16 trials).Taking into account the importance of time to presentation, the PCI-related delay time, and patient and MI characteristics, as well as whether a regional transfer system is in place (as in Minnesota), we suggest an algorithmic approach to the management of ST-elevation MI at a non-PCI facility (Figure 2).
If an effective transfer system is in place, primary PCI not preceded by thrombolytic therapy or glycoprotein IIb/IIIa inhibitor therapy is the preferred approach, according to ACC/AHA and ESC guidelines.31,32 Giving thrombolytics immediately before PCI is harmful and thus should be avoided when the expected door-to-balloon time is 90 minutes or less.
All hospitals (whether or not they offer PCI) and regional emergency medical services should participate in a community-based system of care for ST-elevation MI, with protocols for expeditious transfer as defined and coordinated by the American Heart Association initiative “Mission: Lifeline.” In addition, a system of field triage and direct transport to the catheterization laboratory of a PCI facility after field activation significantly reduces door-to-balloon times and improves outcomes.42
If such a system is not in place, then a pharmacoinvasive strategy seems best: ie, local full-dose thrombolysis (if not contraindicated) followed by transfer to a PCI facility and routine performance of PCI 2 to 6 hours after thrombolysis—in conjunction with aggressive early dual oral antiplatelet therapy and “downstream” glycoprotein IIb/IIIa inhibition. This approach is associated with outcomes similar to those of primary PCI.15–17,37
Prehospital thrombolysis delivered by paramedics and followed by early transfer to a PCI facility has been associated with further reduction in mortality rates compared with in-hospital thrombolysis (as in the Swedish registry43), and a reduction in death rate comparable to that of primary PCI in patients presenting early. This is an adequate strategy in regions where such a system can be established.5,17,38,43,44
Patients presenting more than 3 to 4 hours after symptom onset, older patients, and patients with lower-risk MI or a higher risk of bleeding may still be suited for primary PCI even when the door-to-balloon time is 90 to 120 minutes, as stated by the European guidelines,32 or when the PCI-related delay time is as long as 100 minutes. 10 On the other hand, while the ACC/AHA guidelines recognize that in these patients the mortality advantage of primary PCI vs thrombolytic therapy is maintained with more prolonged door-to-balloon times, they nevertheless state that the focus should be on developing systems of care to increase the number of patients with access to primary PCI in less than 90 minutes rather than extending the acceptable window for door-to-balloon time.
In conclusion, for patients presenting with ST-elevation MI who cannot undergo timely primary PCI, the best approach seems to be prehospital thrombolysis delivered by paramedics or local thrombolysis at the non-PCI hospital followed by transferring the patient and performing PCI within a few hours. This is especially important in patients with high-risk ST-elevation MI who present early after symptom onset, when the extent of myocardial necrosis associated with delayed primary PCI is largest.
In addition, every community should develop a coordinated transfer strategy between non-PCI and PCI hospitals.
References
Keeley EC, Boura JA, Grines CL. Primary angioplasty versus intravenous thrombolytic therapy for acute myocardial infarction: a quantitative review of 23 randomised trials. Lancet2003; 361:13–20.
Waters RE, Singh KP, Roe MT, et al. Rationale and strategies for implementing community-based transfer protocols for primary percutaneous coronary intervention for acute ST-segment elevation myocardial infarction. J Am Coll Cardiol2004; 43:2153–2159.
Chakrabarti A, Krumholz HM, Wang Y, Rumsfeld JS, Nallamothu BK; National Cardiovascular Data Registry. Time-to-reperfusion in patients undergoing interhospital transfer for primary percutaneous coronary intervention in the U.S: an analysis of 2005 and 2006 data from the National Cardiovascular Data Registry. J Am Coll Cardiol2008; 51:2442–2443.
Widimský P, Budesínský T, Vorác D, et al; ‘PRAGUE’ Study Group Investigators. Long distance transport for primary angioplasty vs immediate thrombolysis in acute myocardial infarction. Final results of the randomized national multicentre trial—PRAGUE-2. Eur Heart J2003; 24:94–104.
Steg PG, Bonnefoy E, Chabaud S, et al; Comparison of Angioplasty and Prehospital Thrombolysis in Acute Myocardial infarction (CAPTIM) Investigators. Impact of time to treatment on mortality after prehospital fibrinolysis or primary angioplasty: data from the CAPTIM randomized clinical trial. Circulation2003; 108:2851–2856.
Kalla K, Christ G, Karnik R, et al; Vienna STEMI Registry Group. Implementation of guidelines improves the standard of care: the Viennese registry on reperfusion strategies in ST-elevation myocardial infarction (Vienna STEMI registry). Circulation2006; 113:2398–2405.
Boersma E, Maas AC, Deckers JW, Simoons ML. Early thrombolytic treatment in acute myocardial infarction: reappraisal of the golden hour. Lancet1996; 348:771–775.
Antman EM, Anbe DT, Armstrong PW, et al; American College of Cardiology; American Heart Association Task Force on Practice Guidelines; Canadian Cardiovascular Society. ACC/AHA guidelines for the management of patients with ST-elevation myocardial infarction: a report of the American College of Cardiology/American Heart Association Task Force on Practice Guidelines (Committee to Revise the 1999 Guidelines for the Management of Patients with Acute Myocardial Infarction). Circulation2004; 110:e82–e292.
Nallamothu BK, Bates ER. Percutaneous coronary intervention versus fibrinolytic therapy in acute myocardial infarction: is timing (almost) everything?Am J Cardiol2003; 92:824–826.
Pinto DS, Kirtane AJ, Nallamothu BK, et al. Hospital delays in reperfusion for ST-elevation myocardial infarction: implications when selecting a reperfusion strategy. Circulation2006; 114:2019–2025.
Boersma E; Primary Coronary Angioplasty vs Thrombolysis Group. Does time matter? A pooled analysis of randomized clinical trials comparing primary percutaneous coronary intervention and in-hospital fibrinolysis in acute myocardial infarction patients. Eur Heart J2006; 27:779–788.
Stenestrand U, Wallentin L; Register of Information and Knowledge About Swedish Heart Intensive Care Admissions (RIKS-HIA). Fibrinolytic therapy in patients 75 years and older with ST-segment-elevation myocardial infarction: one-year follow-up of a large prospective cohort. Arch Intern Med2003; 163:965–971.
Indications for fibrinolytic therapy in suspected acute myocardial infarction: collaborative overview of early mortality and major morbidity results from all randomised trials of more than 1000 patients. Fibrinolytic Therapy Trialists’ (FTT) Collaborative Group. Lancet1994; 343:311–322.
Grines CL, Browne KF, Marco J, et al. A comparison of immediate angioplasty with thrombolytic therapy for acute myocardial infarction. The Primary Angioplasty in Myocardial Infarction Study Group. N Engl J Med1993; 328:673–679.
Cantor WJ, Fitchett D, Borgundvaag B, et al; TRANSFER-AMI Trial Investigators. Routine early angioplasty after fibrinolysis for acute myocardial infarction. N Engl J Med2009; 360:2705–2718.
Di Mario C, Dudek D, Piscione F, et al; CARESS-in-AMI (Combined Abciximab RE-teplase Stent Study in Acute Myocardial Infarction) Investigators. Immediate angioplasty versus standard therapy with rescue angioplasty after thrombolysis in the Combined Abciximab REteplase Stent Study in Acute Myocardial Infarction (CARESS-in-AMI): an open, prospective, randomised, multicentre trial. Lancet2008; 371:559–568.
Danchin N, Coste P, Ferrières J, et al; FAST-MI Investigators. Comparison of thrombolysis followed by broad use of percutaneous coronary intervention with primary percutaneous coronary intervention for ST-segment-elevation acute myocardial infarction: data from the French registry on Acute ST-elevation Myocardial Infarction (FAST-MI). Circulation2008; 118:268–276.
Assessment of the Safety and Efficacy of a New Treatment Strategy with Percutaneous Coronary Intervention (ASSENT-4 PCI) investigators. Primary versus tenecteplase-facilitated percutaneous coronary intervention in patients with ST-segment elevation acute myocardial infarction (ASSENT-4 PCI): randomised trial. Lancet2006; 367:569–578.
Ellis SG, Tendera M, de Belder MA, et al; FINESSE Investigators. Facilitated PCI in patients with ST-elevation myocardial infarction. N Engl J Med2008; 358:2205–2217.
Carver A, Rafelt S, Gershlick AH, Fairbrother KL, Hughes S, Wilcox R; REACT Investigators. Longer-term follow-up of patients recruited to the REACT (Rescue Angioplasty Versus Conservative Treatment or Repeat Thrombolysis) trial. J Am Coll Cardiol2009; 54:118–126.
Rasmanis G, Vesterqvist O, Gréen K, Edhag O, Henriksson P. Evidence of increased platelet activation after thrombolysis in patients with acute myocardial infarction. Br Heart J1992; 68:374–376.
Gurbel PA, Serebruany VL, Shustov AR, et al. Effects of reteplase and alteplase on platelet aggregation and major receptor expression during the first 24 hours of acute myocardial infarction treatment. GUSTO-III Investigators. Global Use of Strategies to Open Occluded Coronary Arteries. J Am Coll Cardiol1998; 31:1466–1473.
Coulter SA, Cannon CP, Ault KA, et al. High levels of platelet inhibition with abciximab despite heightened platelet activation and aggregation during thrombolysis for acute myocardial infarction: results from TIMI (thrombolysis in myocardial infarction) 14. Circulation2000; 101:2690–2695.
Ross AM, Huber K, Zeymer U, et al. The impact of place of enrollment and delay to reperfusion on 90-day post-infarction mortality in the ASSENT-4 PCI trial: assessment of the safety and efficacy of a new treatment strategy with percutaneous coronary intervention. JACC Cardiovasc Interv2009; 2:925–930.
Herrmann HC, Lu J, Brodie BR, et al; FINESSE Investigators. Benefit of facilitated percutaneous coronary intervention in high-risk ST-segment elevation myocardial infarction patients presenting to nonpercutaneous coronary intervention hospitals. JACC Cardiovasc Interv2009; 2:917–924.
Scheller B, Hennen B, Hammer B, et al; SIAM III Study Group. Beneficial effects of immediate stenting after thrombolysis in acute myocardial infarction. J Am Coll Cardiol2003; 42:634–641.
Fernandez-Avilés F, Alonso JJ, Castro-Beiras A, et al; GRACIA (Grupo de Análisis de la Cardiopatía Isquémica Aguda) Group. Routine invasive strategy within 24 hours of thrombolysis versus ischaemiaguided conservative approach for acute myocardial infarction with ST-segment elevation (GRACIA-1): a randomised controlled trial. Lancet2004; 364:1045–1053.
Le May MR, Wells GA, Labinaz M, et al. Combined angioplasty and pharmacological intervention versus thrombolysis alone in acute myocardial infarction (CAPITAL AMI study). J Am Coll Cardiol2005; 46:417–424.
Bøhmer E, Hoffmann P, Abdelnoor M, Arnesen H, Halvorsen S. Efficacy and safety of immediate angioplasty versus ischemia-guided management after thrombolysis in acute myocardial infarction in areas with very long transfer distances results of the NORDISTEMI (NORwegian study on DIstrict treatment of ST-elevation myocardial infarction). J Am Coll Cardiol2010; 55:102–110.
Wijeysundera HC, You JJ, Nallamothu BK, Krumholz HM, Cantor WJ, Ko DT. An early invasive strategy versus ischemia-guided management after fibrinolytic therapy for ST-segment elevation myocardial infarction: a meta-analysis of contemporary randomized controlled trials. Am Heart J2008; 156:564–572,572.e1–e2.
Kushner FG, Hand M, Smith SC, et al. 2009 focused updates: ACC/AHA guidelines for the management of patients with ST-elevation myocardial infarction (updating the 2004 guideline and 2007 focused update) and ACC/AHA/SCAI guidelines on percutaneous coronary intervention (updating the 2005 guideline and 2007 focused update) a report of the American College of Cardiology Foundation/American Heart Association Task Force on Practice Guidelines. J Am Coll Cardiol2009; 54:2205–2241.
Van de Werf F, Bax J, Betriu A, et al. Management of acute myocardial infarction in patients presenting with persistent ST-segment elevation: the Task Force on the Management of ST-Segment Elevation Acute Myocardial Infarction of the European Society of Cardiology. Eur Heart J2008; 29:2909–2945.
Mukherjee D, Moliterno DJ. The timely coupling of mechanical revascularization following thrombolysis for myocardial infarction. Cardiology2007; 107:337–339.
Wijeysundera HC, Vijayaraghavan R, Nallamothu BK, et al. Rescue angioplasty or repeat fibrinolysis after failed fibrinolytic therapy for ST-segment myocardial infarction: a meta-analysis of randomized trials. J Am Coll Cardiol2007; 49:422–430.
The GUSTO Angiographic Investigators. The effects of tissue plasminogen activator, streptokinase, or both on coronary-artery patency, ventricular function, and survival after acute myocardial infarction. N Engl J Med1993; 329:1615–1622.
Andersen HR, Nielsen TT, Rasmussen K, et al; DANAMI-2 Investigators. A comparison of coronary angioplasty with fibrinolytic therapy in acute myocardial infarction. N Engl J Med2003; 349:733–742.
Henry TD, Sharkey SW, Burke MN, et al. A regional system to provide timely access to percutaneous coronary intervention for ST-elevation myocardial infarction. Circulation2007; 116:721–728.
Denktas AE, Athar H, Henry TD, et al. Reduced-dose fibrinolytic acceleration of ST-segment elevation myocardial infarction treatment coupled with urgent percutaneous coronary intervention compared to primary percutaneous coronary intervention alone results of the AMICO (Alliance for Myocardial Infarction Care Optimization) Registry. JACC Cardiovasc Interv2008; 1:504–510.
Smalling RW. Ischemic time: the new gold standard for ST-segment elevation myocardial infarction care. J Am Coll Cardiol2009; 54:2154–2156.
Hochman JS, Sleeper LA, White HD, et al; SHOCK Investigators. Should We Emergently Revascularize Occluded Coronaries for Cardiogenic Shock. One-year survival following early revascularization for cardiogenic shock. JAMA2001; 285:190–192.
Jacobs AK, Leopold JA, Bates E, et al. Cardiogenic shock caused by right ventricular infarction: a report from the SHOCK registry. J Am Coll Cardiol2003; 41:1273–1279.
Pedersen SH, Galatius S, Hansen PR, et al. Field triage reduces treatment delay and improves long-term clinical outcome in patients with acute ST-segment elevation myocardial infarction treated with primary percutaneous coronary intervention. J Am Coll Cardiol2009; 54:2296–2302.
Björklund E, Stenestrand U, Lindbäck J, Svensson L, Wallentin L, Lindahl B. Pre-hospital thrombolysis delivered by paramedics is associated with reduced time delay and mortality in ambulance-transported real-life patients with ST-elevation myocardial infarction. Eur Heart J2006; 27:1146–1152.
The European Myocardial Infarction Project Group. Prehospital thrombolytic therapy in patients with suspected acute myocardial infarction. N Engl J Med1993; 329:383–389.
Elias B. Hanna, MD Currently in the Department of Medicine, Cardiovascular Section, Louisiana State University, New Orleans; this article written while in the Department of Medicine, Cardiovascular Section, University of Oklahoma Health Sciences Center, Oklahoma City
Thomas A. Hennebry, MD Department of Medicine, Cardiovascular Section, University of Oklahoma Health Sciences Center, Oklahoma City
Mazen S. Abu-Fadel, MD Department of Medicine, Cardiovascular Section, University of Oklahoma Health Sciences Center, Oklahoma City
Address: Elias B. Hanna, MD, Department of Medicine, Section of Cardiology, Louisiana State University, Room 323, Box T4M-2, 1542 Tulane Avenue, New Orleans, LA 70112; e-mail ehanna10@yahoo.com
Author and Disclosure Information
Elias B. Hanna, MD Currently in the Department of Medicine, Cardiovascular Section, Louisiana State University, New Orleans; this article written while in the Department of Medicine, Cardiovascular Section, University of Oklahoma Health Sciences Center, Oklahoma City
Thomas A. Hennebry, MD Department of Medicine, Cardiovascular Section, University of Oklahoma Health Sciences Center, Oklahoma City
Mazen S. Abu-Fadel, MD Department of Medicine, Cardiovascular Section, University of Oklahoma Health Sciences Center, Oklahoma City
Address: Elias B. Hanna, MD, Department of Medicine, Section of Cardiology, Louisiana State University, Room 323, Box T4M-2, 1542 Tulane Avenue, New Orleans, LA 70112; e-mail ehanna10@yahoo.com
Effective and rapid reperfusion is crucial in patients with acute ST-segment elevation myocardial infarction (MI). The preferred strategy for reperfusion—when it can be performed in a timely fashion at an experienced facility—is primary percutaneous coronary intervention (PCI), which produces outcomes superior to those of pharmacologic thrombolysis.1
Unfortunately, in the United States about half of patients present to hospitals that do not have PCI capability,2 and in one analysis, 91% of transferred patients had a door-to-balloon time greater than the recommended 90 minutes, with a mean of 152 minutes.3 (In this case, the door-to-balloon time was the time that elapsed between entry into the first hospital and inflation of the PCI balloon at the second hospital.)
In situations such as these, a combined approach may be appropriate, with thrombolysis delivered by paramedics or at a local facility, followed by transfer to a PCI facility and performance of PCI within a few hours. However, this is feasible only if standardized community-based or regional protocols for prompt transfer and reperfusion are in place.
In this paper we discuss the rationale and the clinical data behind several approaches to combined reperfusion, as well as experiences with community-based care protocols.
WITHIN 3 HOURS OF SYMPTOM ONSET, THROMBOLYSIS IS AS GOOD AS PCI
The PRAGUE-2 Trial
In the randomized PRAGUE-2 trial,4 patients with ST-elevation MI who presented to a non-PCI facility had better outcomes if they were transferred promptly for PCI (median door-to-balloon time 97 minutes), as opposed to receiving local therapy with streptokinase. However, for patients presenting within 3 hours of symptom onset, the mortality rates were comparable with either strategy.4
See the glossary of clinical trial names below
The CAPTIM trial
In the CAPTIM trial,5 patients who presented within 2 hours of symptom onset and who were randomized to receive prehospital thrombolysis had outcomes similar to those of patients treated with primary PCI, despite a short door-to-balloon time (82 minutes).
The Vienna STEMI Registry
In the Vienna STEMI Registry,6 the mortality rates with primary PCI and with thrombolysis were similar when patients presented within 2 hours of symptom onset. However, as the time from symptom onset increased, primary PCI appeared to offer an increasing survival benefit compared with thrombolysis.
Comments: Thrombolysis is effective mostly in the first 2 to 3 hours, with some benefit up to 12 hours
Previous studies have shown that the sooner thrombolysis is given after symptom onset, the more effective it is. If it is given within an hour of symptom onset, the relative reduction in the mortality rate is 50% and the absolute reduction is 6.5% compared with no reperfusion therapy. If it is started in the second hour, the absolute reduction in the mortality rate drops to 4%, and a lesser benefit extends to patients presenting up to 12 hours after symptom onset.7 This time-dependent benefit is due to the fact that very early reperfusion of the occluded coronary artery may lead to full recovery of ischemic tissue and thus prevent necrosis. In addition, thrombolysis in the first 2 hours is highly efficacious in lysing a fresh thrombus.
These data support the current guidelines of the American College of Cardiology (ACC) and the American Heart Association (AHA), which state no preference for either thrombolytic therapy or PCI in ST-elevation MI if the presentation is less than 3 hours after symptom onset.8
Of note, in the CAPTIM trial and in the Vienna STEMI Registry, rescue PCI was available and was in fact used after thrombolysis in about 25% of patients, which might have contributed to the benefit of early thrombolysis.
PRIMARY PCI MAY NOT BE SUPERIOR IF TRANSFER TIME IS LONG
Another time-related factor to consider is the PCI-related delay, ie, the theoretical difference between the expected time from first medical contact to balloon inflation (if the patient undergoes primary PCI) and the time from first medical contact to the start of thrombolytic therapy (if the patient undergoes primary thrombolysis).
A meta-analysis of 13 trials comparing PCI and thrombolysis showed that a PCI-related delay of more than 60 minutes might negate the potential advantage of primary PCI over immediate thrombolysis in terms of deaths.9
This observation has been further refined by data from the National Registry of Myocardial Infarction.10 In this analysis, patient factors, including age, duration of symptoms, and infarct location, significantly affected the point at which the PCI-related delay negated the survival advantage of primary PCI. The survival advantage of primary PCI was lost more rapidly—with a PCI-related delay as short as 40 minutes—in patients who presented sooner, were younger, or had anterior MI. Primary PCI maintained its survival advantage even with a PCI-related delay longer than 100 minutes in older patients or patients with nonanterior MI presenting more than 3 hours after symptom onset. Given that median door-to-balloon times in the United States may exceed 150 minutes when transfer is involved, 3 primary PCI may be no better than primary thrombolysis in transferred patients who present early or who have large infarcts.
Although these results were derived from a post hoc analysis of a registry and the delay times reported were sometimes inaccurate, they suggest that both the PCI-related delay time and patient characteristics should be considered when selecting a reperfusion strategy. Thrombolytic therapy before and in conjunction with primary PCI was considered a potential solution to these concerns.
In addition, while the benefit of any reperfusion strategy depends on the time of presentation, the loss in benefit by later presentation is less pronounced with primary PCI than with thrombolysis, making thrombolysis less attractive in later presentations (> 3 hours).11
Also, while thrombolytic therapy in patients older than 75 years was associated with a lower mortality rate compared with no therapy in a large Swedish registry,12 this benefit was less striking than in younger patients. A meta-analysis of thrombolysis trials failed to show a similar benefit in patients over age 75 vs younger patients,13 whereas primary PCI remained effective and superior to thrombolysis in the elderly, with more absolute reduction in mortality rates in the elderly subgroup than with younger patients. 14 This makes thrombolysis less attractive in the elderly, either as a stand-alone therapy or in conjunction with PCI. Studies of combined thrombolysis and PCI included very few patients over age 75.15–17
THREE COMBINATION REPERFUSION STRATEGIES
Figure 1. The timing of percutaneous coronary intervention (PCI) in relation to thrombolysis in the pharmacoinvasive strategy, rescue PCI strategy, and facilitated PCI strategy, with the respective clinical trials that addressed and defined these strategies. (See the glossary above for complete names of studies.)Three different combination reperfusion strategies for ST-elevation MI have been studied (Figure 1)15,16,18–20:
Facilitated PCI is a strategy of thrombolysis immediately followed by PCI, with a planned door-to-balloon time of 90 to 120 minutes.
Pharmacoinvasive therapy means giving thrombolysis at a non-PCI facility and then promptly and systematically transferring the patient to a PCI facility, where PCI is performed 2 to 24 hours after the start of thrombolytic therapy, regardless of whether thrombolysis results in successful reperfusion. 15 Thus, the time to PCI is longer than with facilitated PCI. Facilitated PCI addresses the value of pretreatment with thrombolytics or glycoprotein IIb/IIIa inhibitors in patients otherwise eligible for primary PCI, whereas pharmacoinvasive therapy addresses the value of routine early PCI after thrombolysis in patients who are not eligible for primary PCI.16
Rescue PCI refers to PCI that is performed urgently if thrombolysis fails, failure being defined as persistent hemodynamic or electrical instability, persistent ischemic symptoms, or failure to achieve at least a 50% to 70% resolution of the maximal ST-segment elevation 90 minutes after the infusion is started.
FACILITATED PCI: NEGATIVE RESULTS IN CLINICAL TRIALS
ASSENT-4 PCI trial
In the ASSENT-4 PCI trial,18 patients receiving full thrombolytic therapy before PCI had a higher rate of in-hospital death, bleeding, and cardiovascular events at 90 days than patients treated with primary PCI.
This trial recruited patients arriving at hospitals with or without PCI capability. The door-to-balloon time was about 110 minutes in both groups, which might not have been prolonged enough to show a benefit from a timely addition of thrombolysis. In addition, antiplatelet therapy was limited in these patients: glycoprotein IIb/IIIa inhibitors were not given, and clopidogrel (Plavix) was not appropriately preloaded, and this might have offset the potential benefit of early PCI. In fact, data suggest that platelet activation and aggregation are heightened after thrombolysis, 21–23 and that glycoprotein IIb/IIIa antagonists can inhibit these effects.23
The FINESSE trial
In the FINESSE trial,19 patients were randomized to undergo primary PCI, to undergo PCI facilitated (ie, preceded) by abciximab (Reo-Pro), or to undergo PCI facilitated by half-dose reteplase (Retavase) and full-dose abciximab. Despite a median door-to-balloon time of 132 minutes, the three strategies were associated with similar rates of death, heart failure, or ischemic outcome at 90 days. Even though the dosage of heparin was weight-adjusted, more major bleeding events occurred with the facilitated strategies.
Comments: Some subgroups may still benefit from facilitated PCI
The results of ASSENT-4 PCI and FINESSE led to the conclusion that PCI facilitated by full-dose thrombolysis should be avoided, and called into question the value of PCI facilitation using glycoprotein IIb/IIIa inhibitors with or without half-dose thrombolytic therapy.
However, subgroup analyses of these trials identified some subgroups that may benefit from a facilitated strategy. In ASSENT-4 PCI, 45% of patients were enrolled at PCI hospitals with a minimal PCI-related delay time. These patients had the worst outcome with the facilitated strategy. In contrast, patients who had a short time from pain onset to thrombolysis (2 to 3 hours) and who were given prehospital thrombolysis had a trend toward better outcomes with facilitated PCI.24 And in FINESSE, 60% of patients were enrolled at centers with PCI capability. Analysis of a small subgroup of patients with a Thrombolysis in Myocardial Infarction study (TIMI) risk score of 3 or greater presenting to non-PCI hospitals within 4 hours of symptom onset suggested a potential reduction of ischemic events with the facilitated strategy in these patients.25
Thus, for patients seen in the first 2 to 3 hours after symptom onset, immediate thrombolysis is recommended if PCI will likely be delayed, with or without plans for subsequent early PCI. “Time is muscle,” especially during the first 3 hours.
PHARMACOINVASIVE STRATEGY: GOOD RESULTS IN HIGH-RISK PATIENTS
A number of randomized studies during the last 10 years have examined the value of a pharmacoinvasive strategy.15,16,26–29
The TRANSFER-AMI trial
The TRANSFER-AMI trial15 randomized 1,059 patients with high-risk ST-elevation MI (ie, anterior or high-risk inferior) at non-PCI centers to undergo either pharmacoinvasive care, ie, full-dose tenecteplase (TNKase) with immediate transfer for PCI or standard care, ie, tenecteplase with transfer for rescue PCI if the patient had persistent ST-segment elevation, chest pain, or hemodynamic instability.15 The goal was to perform PCI within 6 hours of thrombolysis, and the median time to PCI was 3.9 hours (range 2–6 hours). In the standard-care group, 35% of patients needed to be transferred for rescue PCI. Unlike in the ASSENT-4 trial, over 80% of patients received aggressive antiplatelet therapy with both 300 mg of clopidogrel and glycoprotein IIb/IIIa inhibitors.
The rate of cardiovascular events at 30 days was significantly lower with pharmacoinvasive therapy than with standard care and rescue PCI (11% vs 17%, P = .004). This difference was driven by lower rates of recurrent ischemia, reinfarction, and heart failure.
The CARESS-in-AMI study
The CARESS-in-AMI study16 found a similar improvement in ischemic outcomes in 600 patients with high-risk ST-elevation MI arriving at non-PCI centers if they had received pharmacoinvasive therapy. Patients received half-dose reteplase and abciximab and were randomized either to be immediately transferred for PCI (median time to PCI 2.25 hours) or to be transferred only if they had persistent ST-segment elevation or clinical deterioration.16 The event rate was low with pharmacoinvasive therapy, comparable to that achieved in primary PCI trials.
Interestingly, no significant increase was seen in the risk of major and minor bleeding in these two trials despite the use of a femoral approach for PCI in over 80% of the cases; this is probably due to the delays between thrombolytic administration and PCI and to the use of a highly fibrin-specific thrombolytic agent and adjusted-dose heparin.
Meta-analysis of pharmacoinvasive trials
A meta-analysis29 of studies of systematic early PCI (mainly with stenting) within 24 hours of thrombolysis showed a reduction in the rates of mortality and reinfarction with this strategy, without an increase in the risk of major or intracranial bleeding.30 In contrast to the results of the trials of facilitated PCI, a pharmacoinvasive strategy improved outcomes in these trials because the delay between thrombolysis and PCI was more than 2 hours, ie, long enough to prevent bleeding complications, and because most patients randomized in these trials presented within 2 to 3 hours of symptom onset, when the time to reperfusion is critical. After 3 hours, the PCI-mediated myocardial salvage is less time-dependent. Moreover, trials of pharmacoinvasive strategy used aggressive antiplatelet therapy with clopidogrel and glycoprotein IIb/IIIa inhibitors.
Comment: Pharmacoinvasive strategy in the guidelines
These results and those of the subgroup analysis from the FINESSE trial suggest that patients with high-risk ST-elevation MI treated at non-PCI hospitals have better outcomes without an increase in major bleeding events when given thrombolysis and then immediately transferred for routine PCI, rather than being transferred only if reperfusion fails.
Hence, the 2009 update of the ACC/AHA guidelines31 gives a class IIa recommendation for transferring patients with anterior ST-elevation MI or high-risk inferior ST-elevation MI treated with thrombolysis to a PCI-capable facility where PCI is performed as part of a pharmacoinvasive or rescue strategy soon after thrombolysis.
This strategy has been particularly studied in patients younger than 75 years presenting with high-risk types of ST-elevation MI early (< 3 hours) after symptom onset. If not at high risk, the patient may be transferred to a PCI facility after receiving thrombolysis or observed in the initial facility (class IIb recommendation). Consideration should be given to starting anticoagulant and antiplatelet therapy before and during transfer—ie, 300 mg of clopidogrel before transfer for PCI and glycoprotein IIb/IIIa inhibitor therapy during PCI.
The European Society of Cardiology (ESC) guidelines32 recommend early routine angiography 3 to 24 hours after successful thrombolysis. This time window was selected to avoid PCI during the prothrombotic period in the first few hours after thrombolysis and to minimize the risk of reocclusion with PCI delays of more than 24 hours (class IIa recommendation).
Larger randomized trials are still needed to establish whether the pharmacoinvasive strategy confers a survival benefit, to determine its usefulness in low-risk inferior or lateral ST-elevation MI, and to further refine the time window when PCI is both safe and beneficial after thrombolysis.33
RESCUE PCI REDUCES MORTALITY RATES
Rescue PCI is the most accepted form of thrombolysis-PCI combination.
The REACT trial
The REACT trial20 showed that rescue PCI performed at a mean of 4.5 hours after failed thrombolysis reduces the rate of adverse cardiovascular events by more than 50% at 6 to 12 months and reduces the 5-year mortality rate by more than 50% compared with conservative management.20 As in the pharmacoinvasive strategy, aggressive antiplatelet regimens were used in the REACT trial.
A meta-analysis of rescue PCI trials
A meta-analysis of rescue PCI trials34 confirmed these results, showing a reduction in heart failure and reinfarction and a trend toward a lower mortality rate with rescue PCI.34 After thrombolysis, 40% of patients do not achieve grade 3 TIMI flow, which explains why in modern clinical trials 30% of patients treated with thrombolysis require rescue PCI.5,15,16,35
For patients with high-risk ST-elevation MI, current ACC/AHA guidelines assign a class IIa recommendation to rescue PCI.31
WHEN PATIENTS WITH ST-ELEVATION MI PRESENT TO A NON-PCI HOSPITAL
Transfer for primary PCI vs thrombolysis at the non-PCI hospital
The DANAMI-2 trial36 found that immediate transfer for PCI was superior to onsite thrombolytic therapy, as measured by a reduction in the rate of ischemic events (composite of death, myocardial infarction, or stroke at 30 days): 8.5% vs 14.2% (P < .001). There were no deaths during transfer.3
The PRAGUE-2 trial4 showed similar results for patients presenting 3 to 12 hours after symptom onset (30-day mortality rate 6% with immediate transfer vs 15.3% with on-site thrombolysis, P < .002), whereas patients presenting within 3 hours of symptom onset had a similar mortality rate with either therapy.4
Comment. These trials showed that transfer for primary PCI is superior to thrombolytic therapy when performed in a timely fashion. However, they were done in countries with established transfer networks and short distances between community hospitals and PCI centers, with a PCI-related delay of only 44 minutes and a door-to-balloon time of 90 minutes despite transfer. The large-scale application of this prompt transfer policy is not practical in most regions in the United States. Thus, a strategy of local thrombolysis followed by routine early transfer for routine or rescue PCI seems warranted when the door-to-balloon time or the PCI-related delay time is expected to be too long.
Experiences with community-based systems of care and prehospital thrombolysis
In Minnesota, Henry et al37 developed a PCI-based treatment system and an integrated transfer program for ST-elevation MI involving 30 hospitals within 210 miles of the Minneapolis Heart Institute. Participating hospitals were divided into two zones: zone 1 hospitals were within 60 miles, and zone 2 facilities were between 60 and 210 miles from the Heart Institute. Zone 2 patients received half-dose tenecteplase (if thrombolytic therapy was not contraindicated) in anticipation of a lengthy transfer time.
The median door-to-balloon time for zone 1 patients was 95 minutes (interquartile range 82 and 116 minutes) and for zone 2 patients 120 minutes (interquartile range 100 and 145 minutes). The diagnosis of ST-elevation MI was made by the emergency department physician, who activated the system with a phone call. The patient was then directly transferred to the catheterization laboratory, most often by helicopter.
The in-hospital death rate for patients who presented to the PCI center and for patients in zones 1 and 2 was similarly low (about 5%).37
In France, the FAST-MI registry,17 which collected outcome data for different reperfusion strategies, found that thrombolysis yielded in-hospital and midterm results that were comparable to those of primary PCI. Of note, thrombolysis was started early after symptom onset (about 2 hours), and was started in the ambulance in two-thirds of cases. Nearly all patients underwent a pharmacoinvasive strategy that combined thrombolysis with coronary angiography and PCI within 24 hours of symptom onset. These findings suggest that timely thrombolysis followed by semiurgent transfer for PCI is an alternative to primary PCI for patients presenting to hospitals with no PCI capability, and that this alternative offers similar benefit to that of primary PCI.
Five centers in the United States have reported their experience with half-dose thrombolysis in the prehospital setting (in the field or during transfer) or at a non-PCI hospital, followed by prompt transfer to a PCI facility. In this registry of almost 3,000 patients,38 patients treated with thrombolysis had better outcomes than patients directly transferred for primary PCI, with a significantly lower 30-day mortality rate (3.8% vs from 6.4%), and no increase in bleeding.38,39 The mean door-to-balloon time was long (168 minutes in the primary PCI group and 196 minutes in the thrombolysis-PCI group), which might explain the benefit achieved with prompt thrombolysis.
CARDIOGENIC SHOCK
Patients presenting with left ventricular cardiogenic shock derive a large mortality benefit from revascularization, whether they are transferred or directly admitted to a PCI center. 40 Moreover, in the SHOCK registry, patients with predominant right ventricular cardiogenic shock had an in-hospital mortality rate similar to that of patients with predominant left ventricular cardiogenic shock, and revascularization (PCI or surgical revascularization) was associated with a strikingly lower mortality rate in both groups.41
Thus, all patients with left or right cardiogenic shock should be revascularized on an emergency basis, either surgically or percutaneously.
While trials of pharmacoinvasive therapy excluded patients with cardiogenic shock,15,16 thrombolytic therapy was associated with improved outcomes in the drug-therapy group of the SHOCK trial and in hypotensive patients randomized in the early thrombolysis trials.13 Thus, the ACC/AHA guidelines recommend thrombolytic therapy before transfer if a patient presents in shock within 3 to 6 hours of onset of the MI and delays in transport and intervention are anticipated.8
PUTTING IT ALL TOGETHER: MANAGEMENT STRATEGIES
Figure 2. Selecting the appropriate reperfusion strategy in ST-elevation myocardial infarction (MI). Routine early PCI is particularly indicated in high-risk MI, ie, either anterior MI, or inferior MI with one of the following: systolic blood pressure of less than 100 mm Hg, heart rate of more than 100 beats per minute, Killip class II or III, ST-segment depression of 2 mm or more in the anterior leads, or ST-segment elevation of 1 mm or more in the right-sided lead V4, which is indicative of right ventricular involvement. Dual antiplatelet therapy with aspirin and clopidogrel (Plavix) 300 mg should be started as soon as possible in all patients, and consideration should be given to glycoprotein IIb/IIIa inhibition for most patients during PCI (as in the TRANSFER-AMI15 and CARESS-in-AMI16 trials).Taking into account the importance of time to presentation, the PCI-related delay time, and patient and MI characteristics, as well as whether a regional transfer system is in place (as in Minnesota), we suggest an algorithmic approach to the management of ST-elevation MI at a non-PCI facility (Figure 2).
If an effective transfer system is in place, primary PCI not preceded by thrombolytic therapy or glycoprotein IIb/IIIa inhibitor therapy is the preferred approach, according to ACC/AHA and ESC guidelines.31,32 Giving thrombolytics immediately before PCI is harmful and thus should be avoided when the expected door-to-balloon time is 90 minutes or less.
All hospitals (whether or not they offer PCI) and regional emergency medical services should participate in a community-based system of care for ST-elevation MI, with protocols for expeditious transfer as defined and coordinated by the American Heart Association initiative “Mission: Lifeline.” In addition, a system of field triage and direct transport to the catheterization laboratory of a PCI facility after field activation significantly reduces door-to-balloon times and improves outcomes.42
If such a system is not in place, then a pharmacoinvasive strategy seems best: ie, local full-dose thrombolysis (if not contraindicated) followed by transfer to a PCI facility and routine performance of PCI 2 to 6 hours after thrombolysis—in conjunction with aggressive early dual oral antiplatelet therapy and “downstream” glycoprotein IIb/IIIa inhibition. This approach is associated with outcomes similar to those of primary PCI.15–17,37
Prehospital thrombolysis delivered by paramedics and followed by early transfer to a PCI facility has been associated with further reduction in mortality rates compared with in-hospital thrombolysis (as in the Swedish registry43), and a reduction in death rate comparable to that of primary PCI in patients presenting early. This is an adequate strategy in regions where such a system can be established.5,17,38,43,44
Patients presenting more than 3 to 4 hours after symptom onset, older patients, and patients with lower-risk MI or a higher risk of bleeding may still be suited for primary PCI even when the door-to-balloon time is 90 to 120 minutes, as stated by the European guidelines,32 or when the PCI-related delay time is as long as 100 minutes. 10 On the other hand, while the ACC/AHA guidelines recognize that in these patients the mortality advantage of primary PCI vs thrombolytic therapy is maintained with more prolonged door-to-balloon times, they nevertheless state that the focus should be on developing systems of care to increase the number of patients with access to primary PCI in less than 90 minutes rather than extending the acceptable window for door-to-balloon time.
In conclusion, for patients presenting with ST-elevation MI who cannot undergo timely primary PCI, the best approach seems to be prehospital thrombolysis delivered by paramedics or local thrombolysis at the non-PCI hospital followed by transferring the patient and performing PCI within a few hours. This is especially important in patients with high-risk ST-elevation MI who present early after symptom onset, when the extent of myocardial necrosis associated with delayed primary PCI is largest.
In addition, every community should develop a coordinated transfer strategy between non-PCI and PCI hospitals.
References
Keeley EC, Boura JA, Grines CL. Primary angioplasty versus intravenous thrombolytic therapy for acute myocardial infarction: a quantitative review of 23 randomised trials. Lancet2003; 361:13–20.
Waters RE, Singh KP, Roe MT, et al. Rationale and strategies for implementing community-based transfer protocols for primary percutaneous coronary intervention for acute ST-segment elevation myocardial infarction. J Am Coll Cardiol2004; 43:2153–2159.
Chakrabarti A, Krumholz HM, Wang Y, Rumsfeld JS, Nallamothu BK; National Cardiovascular Data Registry. Time-to-reperfusion in patients undergoing interhospital transfer for primary percutaneous coronary intervention in the U.S: an analysis of 2005 and 2006 data from the National Cardiovascular Data Registry. J Am Coll Cardiol2008; 51:2442–2443.
Widimský P, Budesínský T, Vorác D, et al; ‘PRAGUE’ Study Group Investigators. Long distance transport for primary angioplasty vs immediate thrombolysis in acute myocardial infarction. Final results of the randomized national multicentre trial—PRAGUE-2. Eur Heart J2003; 24:94–104.
Steg PG, Bonnefoy E, Chabaud S, et al; Comparison of Angioplasty and Prehospital Thrombolysis in Acute Myocardial infarction (CAPTIM) Investigators. Impact of time to treatment on mortality after prehospital fibrinolysis or primary angioplasty: data from the CAPTIM randomized clinical trial. Circulation2003; 108:2851–2856.
Kalla K, Christ G, Karnik R, et al; Vienna STEMI Registry Group. Implementation of guidelines improves the standard of care: the Viennese registry on reperfusion strategies in ST-elevation myocardial infarction (Vienna STEMI registry). Circulation2006; 113:2398–2405.
Boersma E, Maas AC, Deckers JW, Simoons ML. Early thrombolytic treatment in acute myocardial infarction: reappraisal of the golden hour. Lancet1996; 348:771–775.
Antman EM, Anbe DT, Armstrong PW, et al; American College of Cardiology; American Heart Association Task Force on Practice Guidelines; Canadian Cardiovascular Society. ACC/AHA guidelines for the management of patients with ST-elevation myocardial infarction: a report of the American College of Cardiology/American Heart Association Task Force on Practice Guidelines (Committee to Revise the 1999 Guidelines for the Management of Patients with Acute Myocardial Infarction). Circulation2004; 110:e82–e292.
Nallamothu BK, Bates ER. Percutaneous coronary intervention versus fibrinolytic therapy in acute myocardial infarction: is timing (almost) everything?Am J Cardiol2003; 92:824–826.
Pinto DS, Kirtane AJ, Nallamothu BK, et al. Hospital delays in reperfusion for ST-elevation myocardial infarction: implications when selecting a reperfusion strategy. Circulation2006; 114:2019–2025.
Boersma E; Primary Coronary Angioplasty vs Thrombolysis Group. Does time matter? A pooled analysis of randomized clinical trials comparing primary percutaneous coronary intervention and in-hospital fibrinolysis in acute myocardial infarction patients. Eur Heart J2006; 27:779–788.
Stenestrand U, Wallentin L; Register of Information and Knowledge About Swedish Heart Intensive Care Admissions (RIKS-HIA). Fibrinolytic therapy in patients 75 years and older with ST-segment-elevation myocardial infarction: one-year follow-up of a large prospective cohort. Arch Intern Med2003; 163:965–971.
Indications for fibrinolytic therapy in suspected acute myocardial infarction: collaborative overview of early mortality and major morbidity results from all randomised trials of more than 1000 patients. Fibrinolytic Therapy Trialists’ (FTT) Collaborative Group. Lancet1994; 343:311–322.
Grines CL, Browne KF, Marco J, et al. A comparison of immediate angioplasty with thrombolytic therapy for acute myocardial infarction. The Primary Angioplasty in Myocardial Infarction Study Group. N Engl J Med1993; 328:673–679.
Cantor WJ, Fitchett D, Borgundvaag B, et al; TRANSFER-AMI Trial Investigators. Routine early angioplasty after fibrinolysis for acute myocardial infarction. N Engl J Med2009; 360:2705–2718.
Di Mario C, Dudek D, Piscione F, et al; CARESS-in-AMI (Combined Abciximab RE-teplase Stent Study in Acute Myocardial Infarction) Investigators. Immediate angioplasty versus standard therapy with rescue angioplasty after thrombolysis in the Combined Abciximab REteplase Stent Study in Acute Myocardial Infarction (CARESS-in-AMI): an open, prospective, randomised, multicentre trial. Lancet2008; 371:559–568.
Danchin N, Coste P, Ferrières J, et al; FAST-MI Investigators. Comparison of thrombolysis followed by broad use of percutaneous coronary intervention with primary percutaneous coronary intervention for ST-segment-elevation acute myocardial infarction: data from the French registry on Acute ST-elevation Myocardial Infarction (FAST-MI). Circulation2008; 118:268–276.
Assessment of the Safety and Efficacy of a New Treatment Strategy with Percutaneous Coronary Intervention (ASSENT-4 PCI) investigators. Primary versus tenecteplase-facilitated percutaneous coronary intervention in patients with ST-segment elevation acute myocardial infarction (ASSENT-4 PCI): randomised trial. Lancet2006; 367:569–578.
Ellis SG, Tendera M, de Belder MA, et al; FINESSE Investigators. Facilitated PCI in patients with ST-elevation myocardial infarction. N Engl J Med2008; 358:2205–2217.
Carver A, Rafelt S, Gershlick AH, Fairbrother KL, Hughes S, Wilcox R; REACT Investigators. Longer-term follow-up of patients recruited to the REACT (Rescue Angioplasty Versus Conservative Treatment or Repeat Thrombolysis) trial. J Am Coll Cardiol2009; 54:118–126.
Rasmanis G, Vesterqvist O, Gréen K, Edhag O, Henriksson P. Evidence of increased platelet activation after thrombolysis in patients with acute myocardial infarction. Br Heart J1992; 68:374–376.
Gurbel PA, Serebruany VL, Shustov AR, et al. Effects of reteplase and alteplase on platelet aggregation and major receptor expression during the first 24 hours of acute myocardial infarction treatment. GUSTO-III Investigators. Global Use of Strategies to Open Occluded Coronary Arteries. J Am Coll Cardiol1998; 31:1466–1473.
Coulter SA, Cannon CP, Ault KA, et al. High levels of platelet inhibition with abciximab despite heightened platelet activation and aggregation during thrombolysis for acute myocardial infarction: results from TIMI (thrombolysis in myocardial infarction) 14. Circulation2000; 101:2690–2695.
Ross AM, Huber K, Zeymer U, et al. The impact of place of enrollment and delay to reperfusion on 90-day post-infarction mortality in the ASSENT-4 PCI trial: assessment of the safety and efficacy of a new treatment strategy with percutaneous coronary intervention. JACC Cardiovasc Interv2009; 2:925–930.
Herrmann HC, Lu J, Brodie BR, et al; FINESSE Investigators. Benefit of facilitated percutaneous coronary intervention in high-risk ST-segment elevation myocardial infarction patients presenting to nonpercutaneous coronary intervention hospitals. JACC Cardiovasc Interv2009; 2:917–924.
Scheller B, Hennen B, Hammer B, et al; SIAM III Study Group. Beneficial effects of immediate stenting after thrombolysis in acute myocardial infarction. J Am Coll Cardiol2003; 42:634–641.
Fernandez-Avilés F, Alonso JJ, Castro-Beiras A, et al; GRACIA (Grupo de Análisis de la Cardiopatía Isquémica Aguda) Group. Routine invasive strategy within 24 hours of thrombolysis versus ischaemiaguided conservative approach for acute myocardial infarction with ST-segment elevation (GRACIA-1): a randomised controlled trial. Lancet2004; 364:1045–1053.
Le May MR, Wells GA, Labinaz M, et al. Combined angioplasty and pharmacological intervention versus thrombolysis alone in acute myocardial infarction (CAPITAL AMI study). J Am Coll Cardiol2005; 46:417–424.
Bøhmer E, Hoffmann P, Abdelnoor M, Arnesen H, Halvorsen S. Efficacy and safety of immediate angioplasty versus ischemia-guided management after thrombolysis in acute myocardial infarction in areas with very long transfer distances results of the NORDISTEMI (NORwegian study on DIstrict treatment of ST-elevation myocardial infarction). J Am Coll Cardiol2010; 55:102–110.
Wijeysundera HC, You JJ, Nallamothu BK, Krumholz HM, Cantor WJ, Ko DT. An early invasive strategy versus ischemia-guided management after fibrinolytic therapy for ST-segment elevation myocardial infarction: a meta-analysis of contemporary randomized controlled trials. Am Heart J2008; 156:564–572,572.e1–e2.
Kushner FG, Hand M, Smith SC, et al. 2009 focused updates: ACC/AHA guidelines for the management of patients with ST-elevation myocardial infarction (updating the 2004 guideline and 2007 focused update) and ACC/AHA/SCAI guidelines on percutaneous coronary intervention (updating the 2005 guideline and 2007 focused update) a report of the American College of Cardiology Foundation/American Heart Association Task Force on Practice Guidelines. J Am Coll Cardiol2009; 54:2205–2241.
Van de Werf F, Bax J, Betriu A, et al. Management of acute myocardial infarction in patients presenting with persistent ST-segment elevation: the Task Force on the Management of ST-Segment Elevation Acute Myocardial Infarction of the European Society of Cardiology. Eur Heart J2008; 29:2909–2945.
Mukherjee D, Moliterno DJ. The timely coupling of mechanical revascularization following thrombolysis for myocardial infarction. Cardiology2007; 107:337–339.
Wijeysundera HC, Vijayaraghavan R, Nallamothu BK, et al. Rescue angioplasty or repeat fibrinolysis after failed fibrinolytic therapy for ST-segment myocardial infarction: a meta-analysis of randomized trials. J Am Coll Cardiol2007; 49:422–430.
The GUSTO Angiographic Investigators. The effects of tissue plasminogen activator, streptokinase, or both on coronary-artery patency, ventricular function, and survival after acute myocardial infarction. N Engl J Med1993; 329:1615–1622.
Andersen HR, Nielsen TT, Rasmussen K, et al; DANAMI-2 Investigators. A comparison of coronary angioplasty with fibrinolytic therapy in acute myocardial infarction. N Engl J Med2003; 349:733–742.
Henry TD, Sharkey SW, Burke MN, et al. A regional system to provide timely access to percutaneous coronary intervention for ST-elevation myocardial infarction. Circulation2007; 116:721–728.
Denktas AE, Athar H, Henry TD, et al. Reduced-dose fibrinolytic acceleration of ST-segment elevation myocardial infarction treatment coupled with urgent percutaneous coronary intervention compared to primary percutaneous coronary intervention alone results of the AMICO (Alliance for Myocardial Infarction Care Optimization) Registry. JACC Cardiovasc Interv2008; 1:504–510.
Smalling RW. Ischemic time: the new gold standard for ST-segment elevation myocardial infarction care. J Am Coll Cardiol2009; 54:2154–2156.
Hochman JS, Sleeper LA, White HD, et al; SHOCK Investigators. Should We Emergently Revascularize Occluded Coronaries for Cardiogenic Shock. One-year survival following early revascularization for cardiogenic shock. JAMA2001; 285:190–192.
Jacobs AK, Leopold JA, Bates E, et al. Cardiogenic shock caused by right ventricular infarction: a report from the SHOCK registry. J Am Coll Cardiol2003; 41:1273–1279.
Pedersen SH, Galatius S, Hansen PR, et al. Field triage reduces treatment delay and improves long-term clinical outcome in patients with acute ST-segment elevation myocardial infarction treated with primary percutaneous coronary intervention. J Am Coll Cardiol2009; 54:2296–2302.
Björklund E, Stenestrand U, Lindbäck J, Svensson L, Wallentin L, Lindahl B. Pre-hospital thrombolysis delivered by paramedics is associated with reduced time delay and mortality in ambulance-transported real-life patients with ST-elevation myocardial infarction. Eur Heart J2006; 27:1146–1152.
The European Myocardial Infarction Project Group. Prehospital thrombolytic therapy in patients with suspected acute myocardial infarction. N Engl J Med1993; 329:383–389.
When the expected door-to-balloon time is less than 90 minutes and the door-to-balloon time minus the door-to-needle time is less than 60 minutes, the preferred approach is PCI not preceded by thrombolysis.
Evidence suggests that routine early (but not immediate) PCI—ie, 2 to 6 hours after thrombolysis—is beneficial, particularly in patients with high-risk ST-elevation MI.
Hospitals and emergency services should participate in community-based and regional systems of care, with standardized protocols to ensure expeditious transfer and prompt reperfusion.
Prehospital thrombolysis followed by early transfer to a PCI facility as part of a community-based system of care may further improve outcomes of patients with very long transfer times.
Disallow All Ads
Alternative CME
Consolidated Pubs: Do Not Show Source Publication Logo