User login
In surgical comanagement (SCM), surgeons and hospitalists share responsibility of care for surgical patients. While SCM has been increasingly utilized, many of the reported models are a modification of the consultation model, in which a group of rotating hospitalists, internists, or geriatricians care for the surgical patients, often after medical complications may have occured.1-4
In August 2012, we implemented SCM in Orthopedic and Neurosurgery services at our institution.5 This model is unique because the same Internal Medicine hospitalists are dedicated year round to the same surgical service. SCM hospitalists see patients on their assigned surgical service only; they do not see patients on the Internal Medicine service. After the first year of implementing SCM, we conducted a propensity score–weighted study with 17,057 discharges in the pre-SCM group (January 2009 to July 2012) and 5,533 discharges in the post-SCM group (September 2012 to September 2013).5 In this study, SCM was associated with a decrease in medical complications, length of stay (LOS), medical consultations, 30-day readmissions, and cost.5
Since SCM requires ongoing investment by institutions, we now report a follow-up study to explore if there were continued improvements in patient outcomes with SCM. In this study, we evaluate if there was a decrease in medical complications, LOS, number of medical consultations, rapid response team calls, and code blues and an increase in patient satisfaction with SCM in Orthopedic and Neurosurgery services between 2012 and 2018.
METHODS
We included 26,380 discharges from Orthopedic and Neurosurgery services between September 1, 2012, and June 30, 2018, at our academic medical center. We excluded patients discharged in August 2012 as we transitioned to the SCM model. Our Institutional Review Board exempted this study from further review.
SCM Structure
SCM structure was detailed in a prior article.5 We have 3.0 clinical full-time equivalents on the Orthopedic surgery SCM service and 1.2 on the Neurosurgery SCM service. On weekdays, during the day (8
During the day, SCM hospitalists receive the first call for medical issues. After 5
SCM hospitalists screen the entire patient list on their assigned surgery service each day. After screening the patient list, SCM hospitalists formally see select patients with preventable or active medical conditions and write notes on the patient’s chart. There are no set criteria to determine which patients would be seen by SCM. This is because surgeries can decompensate stable medical conditions or new unexpected medical complications may occur. Additionally, in our prior study, we reported that SCM reduced medical complications and LOS regardless of age or patient acuity.5
Outcomes
Our primary outcome was proportion of patients with ≥1 medical complication (sepsis, pneumonia, urinary tract infection, delirium, acute kidney injury, atrial fibrillation, or ileus). Our secondary outcomes included mean LOS, proportion of patients with ≥2 medical consultations, rapid response team calls, code blues, and top-box patient satisfaction score. Though cost is an important consideration in implementing SCM, limited financial data were available. However, since LOS is a key component in calculating direct costs,6 we estimated the cost savings per discharge using mean direct cost per day and the difference in mean LOS between pre- and post-SCM groups.5
We defined medical complications using International Classification of Disease (ICD) Codes 9 or 10 that were coded as “not present on admission” (Appendix 1). We used Hospital Consumer Assessment of Healthcare Providers and Systems (HCAHPS) survey for three questions for patient satisfaction: Did doctors treat with courtesy and respect, listen carefully, and explain things in a way you could understand?
Statistical Analysis
We used regression analysis to assess trends in patient characteristics by year (Appendix 2). Logistic regression with logit link was used to assess the yearly change in our binary outcomes (proportion of patients with ≥1 medical complication, those with ≥2 medical consultations, rapid response team calls, code blue, and top-box patient satisfaction score) and reported odds ratios. Gamma regression with identity link was performed for our continuous outcome (LOS). Beta coefficient was reported to estimate the yearly change in LOS under their original scales. Age, primary insurance, race, Charlson comorbidity score, general or regional anesthesia, surgical service, and duration of surgery were adjusted in the regression analyses for outcomes. SAS 9.4 was used for analysis.
RESULTS
Patient characteristics are shown in Table 1. Overall, 62.8% patients were discharged from Orthopedic surgery service, 72.5% patients underwent elective surgery, and 88.8% received general anesthesia. Between 2012 and 2018, there was a significant increase in the median age of patients (from 60 years to 63 years), mean Charlson comorbidity score increased from 1.07 to 1.46, and median case mix index, a measure of patient acuity, increased from 2.10 to 2.36 (Appendix 2).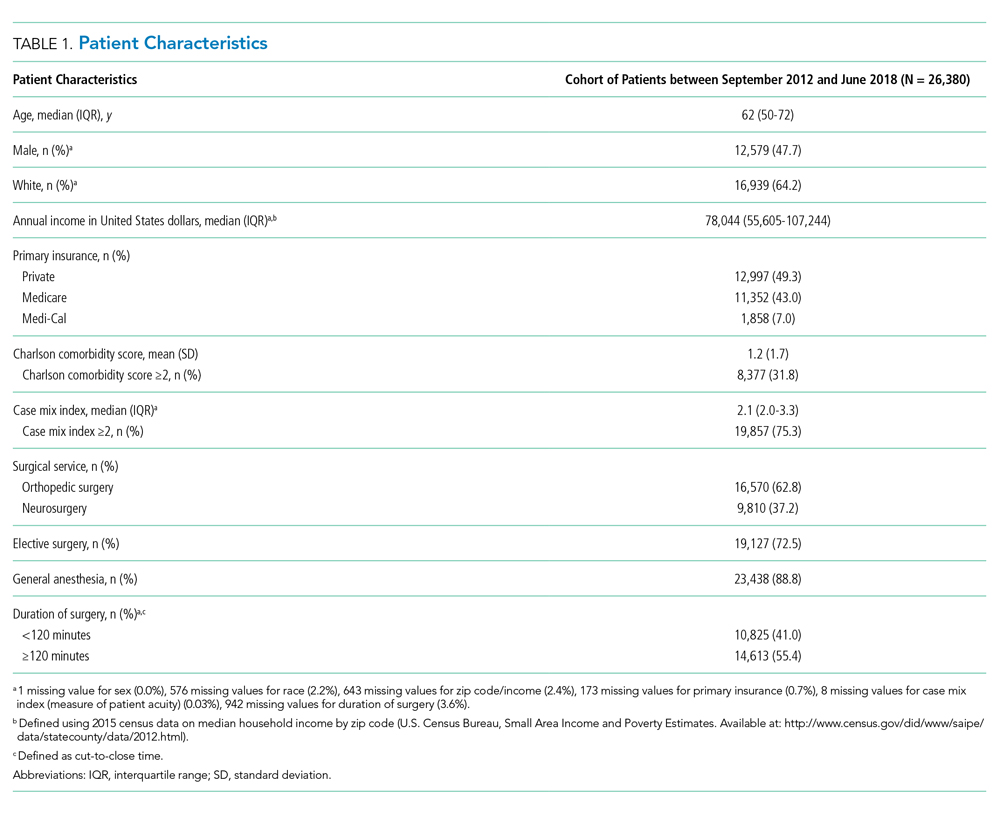
Comparing pre-SCM unadjusted rates reported in our prior study (January 2009 to July 2012) to post-SCM (September 2012 to June 2018; Appendix 3), patients with ≥1 medical complication decreased from 10.1% to 6.1%, LOS (mean ± standard deviation) changed from 5.4 ± 2.2 days to 4.6 ± 5.8 days, patients with ≥2 medical consultations decreased from 19.4% to 9.2%, rapid response team calls changed from 1% to 0.9%, code blues changed from 0.3% to 0.2%, and patients with top-box patient satisfaction score increased from 86.4% to 94.2%.5
In the adjusted analysis from 2012 to 2018, the odds of patients with ≥1 medical complication decreased by 3.8% per year (P = .01), estimated LOS decreased by 0.3 days per year (P < .0001), and the odds of rapid response team calls decreased by 12.2% per year (P = .001; Table 2). Changes over time in the odds of patients with ≥2 medical consultations, code blues, or top-box patient satisfaction score were not statistically significant (Table 2). Based on the LOS reduction pre- to post-SCM, there were estimated average direct cost savings of $3,424 per discharge between 2012 and 2018.
DISCUSSION
Since the implementation of SCM on Orthopedic and Neurosurgery services at our institution, there was a decrease in medical complications, LOS, and rapid response team calls. To our knowledge, this is one of the largest studies evaluating the benefits of SCM over 5.8 years. Similar to our prior studies on this SCM model of care,5,7 other studies have reported a decrease in medical complications,8-10 LOS,11-13 and cost of care14 with SCM.
While the changes in the unadjusted rates of outcomes over the years appeared to be small, while our patient population became older and sicker, there were significant changes in several of our outcomes in the adjusted analysis. We believe that SCM hospitalists have developed a skill set and understanding of these surgical patients over time and can manage more medically complex patients without an increase in medical complications or LOS. We attribute this to our unique SCM model in which the same hospitalists stay year round on the same surgical service. SCM hospitalists have built trusting relationships with the surgical team with greater involvement in decision making, care planning, and patient selection. With minimal turnover in the SCM group and with ongoing learning, SCM hospitalists can anticipate fluid or pain medication requirements after specific surgeries and the surgery-specific medical complications. SCM hospitalists are available on the patient units to provide timely intervention in case of medical deterioration; answer any questions from patients, families, or nursing while the surgical teams may be in the operating room; and coordinate with other medical consultants or outpatient providers as needed.
This study has several limitations. This is a single-center study at an academic institution, limited to two surgical services. We did not have a control group and multiple hospital-wide interventions may have affected these outcomes. This is an observational study in which unobserved variables may bias the results. We used ICD codes to identify medical complications, which relies on the quality of physician documentation. While our response rate of 21.1% for HCAHPS was comparable to the national average of 26.7%, it may not reliably represent our patient population.15 Lastly, we had limited financial data.
CONCLUSION
With the move toward value-based payment and increasing medical complexity of surgical patients, SCM by hospitalists may deliver high-quality care.
1. Auerbach AD, Wachter RM, Cheng HQ, et al. Comanagement of surgical patients between neurosurgeons and hospitalists. Arch Intern Med. 2010;170(22):2004-2010. https://doi.org/10.1001/archinternmed.2010.432
2. Ruiz ME, Merino RÁ, Rodríguez R, Sánchez GM, Alonso A, Barbero M. Effect of comanagement with internal medicine on hospital stay of patients admitted to the service of otolaryngology. Acta Otorrinolaringol Esp. 2015;66(5):264-268. https://doi.org/10.1016/j.otorri.2014.09.010.
3. Tadros RO, Faries PL, Malik R, et al. The effect of a hospitalist comanagement service on vascular surgery inpatients. J Vasc Surg. 2015;61(6):1550-1555. https://doi.org/10.1016/j.jvs.2015.01.006
4. Gregersen M, Mørch MM, Hougaard K, Damsgaard EM. Geriatric intervention in elderly patients with hip fracture in an orthopedic ward. J Inj Violence Res. 2012;4(2):45-51. https://doi.org/10.5249/jivr.v4i2.96
5. Rohatgi N, Loftus P, Grujic O, Cullen M, Hopkins J, Ahuja N. Surgical comanagement by hospitalists improves patient outcomes: A propensity score analysis. Ann Surg. 2016;264(2):275-282. https://doi.org/10.1097/SLA.0000000000001629
6. Polverejan E, Gardiner JC, Bradley CJ, Holmes-Rovner M, Rovner D. Estimating mean hospital cost as a function of length of stay and patient characteristics. Health Econ. 2003;12(11):935-947. https://doi.org/10.1002/hec.774
7. Rohatgi N, Wei PH, Grujic O, Ahuja N. Surgical Comanagement by hospitalists in colorectal surgery. J Am Coll Surg. 2018;227(4):404-410. https://doi.org/10.1016/j.jamcollsurg.2018.06.011
8. Huddleston JM, Long KH, Naessens JM, et al. Medical and surgical comanagement after elective hip and knee arthroplasty: A randomized, controlled trial. Ann Intern Med. 2004;141(1):28-38. https://doi.org/10.7326/0003-4819-141-1-200407060-00012.
9. Swart E, Vasudeva E, Makhni EC, Macaulay W, Bozic KJ. Dedicated perioperative hip fracture comanagement programs are cost-effective in high-volume centers: An economic analysis. Clin Orthop Relat Res. 2016;474(1):222-233. https://doi.org/10.1007/s11999-015-4494-4.
10. Iberti CT, Briones A, Gabriel E, Dunn AS. Hospitalist-vascular surgery comanagement: Effects on complications and mortality. Hosp Pract. 2016;44(5):233-236. https://doi.org/10.1080/21548331.2016.1259543.
11. Kammerlander C, Roth T, Friedman SM, et al. Ortho-geriatric service--A literature review comparing different models. Osteoporos Int. 2010;21(Suppl 4):S637-S646. https://doi.org/10.1007/s00198-010-1396-x.
12. Bracey DN, Kiymaz TC, Holst DC, et al. An orthopedic-hospitalist comanaged hip fracture service reduces inpatient length of stay. Geriatr Orthop Surg Rehabil. 2016;7(4):171-177. https://doi.org/10.1177/2151458516661383.
13. Duplantier NL, Briski DC, Luce LT, Meyer MS, Ochsner JL, Chimento GF. The effects of a hospitalist comanagement model for joint arthroplasty patients in a teaching facility. J Arthroplasty. 2016;31(3):567-572. https://doi.org/10.1016/j.arth.2015.10.010.
14. Roy A, Heckman MG, Roy V. Associations between the hospitalist model of care and quality-of-care-related outcomes in patients undergoing hip fracture surgery. Mayo Clin Proc. 2006;81(1):28-31. https://doi.org/10.4065/81.1.28.
15. Godden E, Paseka A, Gnida J, Inguanzo J. The impact of response rate on Hospital Consumer Assessment of Healthcare Providers and System (HCAHPS) dimension scores. Patient Exp J. 2019;6(1):105-114. https://doi.org/10.35680/2372-0247.1357.
In surgical comanagement (SCM), surgeons and hospitalists share responsibility of care for surgical patients. While SCM has been increasingly utilized, many of the reported models are a modification of the consultation model, in which a group of rotating hospitalists, internists, or geriatricians care for the surgical patients, often after medical complications may have occured.1-4
In August 2012, we implemented SCM in Orthopedic and Neurosurgery services at our institution.5 This model is unique because the same Internal Medicine hospitalists are dedicated year round to the same surgical service. SCM hospitalists see patients on their assigned surgical service only; they do not see patients on the Internal Medicine service. After the first year of implementing SCM, we conducted a propensity score–weighted study with 17,057 discharges in the pre-SCM group (January 2009 to July 2012) and 5,533 discharges in the post-SCM group (September 2012 to September 2013).5 In this study, SCM was associated with a decrease in medical complications, length of stay (LOS), medical consultations, 30-day readmissions, and cost.5
Since SCM requires ongoing investment by institutions, we now report a follow-up study to explore if there were continued improvements in patient outcomes with SCM. In this study, we evaluate if there was a decrease in medical complications, LOS, number of medical consultations, rapid response team calls, and code blues and an increase in patient satisfaction with SCM in Orthopedic and Neurosurgery services between 2012 and 2018.
METHODS
We included 26,380 discharges from Orthopedic and Neurosurgery services between September 1, 2012, and June 30, 2018, at our academic medical center. We excluded patients discharged in August 2012 as we transitioned to the SCM model. Our Institutional Review Board exempted this study from further review.
SCM Structure
SCM structure was detailed in a prior article.5 We have 3.0 clinical full-time equivalents on the Orthopedic surgery SCM service and 1.2 on the Neurosurgery SCM service. On weekdays, during the day (8
During the day, SCM hospitalists receive the first call for medical issues. After 5
SCM hospitalists screen the entire patient list on their assigned surgery service each day. After screening the patient list, SCM hospitalists formally see select patients with preventable or active medical conditions and write notes on the patient’s chart. There are no set criteria to determine which patients would be seen by SCM. This is because surgeries can decompensate stable medical conditions or new unexpected medical complications may occur. Additionally, in our prior study, we reported that SCM reduced medical complications and LOS regardless of age or patient acuity.5
Outcomes
Our primary outcome was proportion of patients with ≥1 medical complication (sepsis, pneumonia, urinary tract infection, delirium, acute kidney injury, atrial fibrillation, or ileus). Our secondary outcomes included mean LOS, proportion of patients with ≥2 medical consultations, rapid response team calls, code blues, and top-box patient satisfaction score. Though cost is an important consideration in implementing SCM, limited financial data were available. However, since LOS is a key component in calculating direct costs,6 we estimated the cost savings per discharge using mean direct cost per day and the difference in mean LOS between pre- and post-SCM groups.5
We defined medical complications using International Classification of Disease (ICD) Codes 9 or 10 that were coded as “not present on admission” (Appendix 1). We used Hospital Consumer Assessment of Healthcare Providers and Systems (HCAHPS) survey for three questions for patient satisfaction: Did doctors treat with courtesy and respect, listen carefully, and explain things in a way you could understand?
Statistical Analysis
We used regression analysis to assess trends in patient characteristics by year (Appendix 2). Logistic regression with logit link was used to assess the yearly change in our binary outcomes (proportion of patients with ≥1 medical complication, those with ≥2 medical consultations, rapid response team calls, code blue, and top-box patient satisfaction score) and reported odds ratios. Gamma regression with identity link was performed for our continuous outcome (LOS). Beta coefficient was reported to estimate the yearly change in LOS under their original scales. Age, primary insurance, race, Charlson comorbidity score, general or regional anesthesia, surgical service, and duration of surgery were adjusted in the regression analyses for outcomes. SAS 9.4 was used for analysis.
RESULTS
Patient characteristics are shown in Table 1. Overall, 62.8% patients were discharged from Orthopedic surgery service, 72.5% patients underwent elective surgery, and 88.8% received general anesthesia. Between 2012 and 2018, there was a significant increase in the median age of patients (from 60 years to 63 years), mean Charlson comorbidity score increased from 1.07 to 1.46, and median case mix index, a measure of patient acuity, increased from 2.10 to 2.36 (Appendix 2).
Comparing pre-SCM unadjusted rates reported in our prior study (January 2009 to July 2012) to post-SCM (September 2012 to June 2018; Appendix 3), patients with ≥1 medical complication decreased from 10.1% to 6.1%, LOS (mean ± standard deviation) changed from 5.4 ± 2.2 days to 4.6 ± 5.8 days, patients with ≥2 medical consultations decreased from 19.4% to 9.2%, rapid response team calls changed from 1% to 0.9%, code blues changed from 0.3% to 0.2%, and patients with top-box patient satisfaction score increased from 86.4% to 94.2%.5
In the adjusted analysis from 2012 to 2018, the odds of patients with ≥1 medical complication decreased by 3.8% per year (P = .01), estimated LOS decreased by 0.3 days per year (P < .0001), and the odds of rapid response team calls decreased by 12.2% per year (P = .001; Table 2). Changes over time in the odds of patients with ≥2 medical consultations, code blues, or top-box patient satisfaction score were not statistically significant (Table 2). Based on the LOS reduction pre- to post-SCM, there were estimated average direct cost savings of $3,424 per discharge between 2012 and 2018.
DISCUSSION
Since the implementation of SCM on Orthopedic and Neurosurgery services at our institution, there was a decrease in medical complications, LOS, and rapid response team calls. To our knowledge, this is one of the largest studies evaluating the benefits of SCM over 5.8 years. Similar to our prior studies on this SCM model of care,5,7 other studies have reported a decrease in medical complications,8-10 LOS,11-13 and cost of care14 with SCM.
While the changes in the unadjusted rates of outcomes over the years appeared to be small, while our patient population became older and sicker, there were significant changes in several of our outcomes in the adjusted analysis. We believe that SCM hospitalists have developed a skill set and understanding of these surgical patients over time and can manage more medically complex patients without an increase in medical complications or LOS. We attribute this to our unique SCM model in which the same hospitalists stay year round on the same surgical service. SCM hospitalists have built trusting relationships with the surgical team with greater involvement in decision making, care planning, and patient selection. With minimal turnover in the SCM group and with ongoing learning, SCM hospitalists can anticipate fluid or pain medication requirements after specific surgeries and the surgery-specific medical complications. SCM hospitalists are available on the patient units to provide timely intervention in case of medical deterioration; answer any questions from patients, families, or nursing while the surgical teams may be in the operating room; and coordinate with other medical consultants or outpatient providers as needed.
This study has several limitations. This is a single-center study at an academic institution, limited to two surgical services. We did not have a control group and multiple hospital-wide interventions may have affected these outcomes. This is an observational study in which unobserved variables may bias the results. We used ICD codes to identify medical complications, which relies on the quality of physician documentation. While our response rate of 21.1% for HCAHPS was comparable to the national average of 26.7%, it may not reliably represent our patient population.15 Lastly, we had limited financial data.
CONCLUSION
With the move toward value-based payment and increasing medical complexity of surgical patients, SCM by hospitalists may deliver high-quality care.
1. Auerbach AD, Wachter RM, Cheng HQ, et al. Comanagement of surgical patients between neurosurgeons and hospitalists. Arch Intern Med. 2010;170(22):2004-2010. https://doi.org/10.1001/archinternmed.2010.432
2. Ruiz ME, Merino RÁ, Rodríguez R, Sánchez GM, Alonso A, Barbero M. Effect of comanagement with internal medicine on hospital stay of patients admitted to the service of otolaryngology. Acta Otorrinolaringol Esp. 2015;66(5):264-268. https://doi.org/10.1016/j.otorri.2014.09.010.
3. Tadros RO, Faries PL, Malik R, et al. The effect of a hospitalist comanagement service on vascular surgery inpatients. J Vasc Surg. 2015;61(6):1550-1555. https://doi.org/10.1016/j.jvs.2015.01.006
4. Gregersen M, Mørch MM, Hougaard K, Damsgaard EM. Geriatric intervention in elderly patients with hip fracture in an orthopedic ward. J Inj Violence Res. 2012;4(2):45-51. https://doi.org/10.5249/jivr.v4i2.96
5. Rohatgi N, Loftus P, Grujic O, Cullen M, Hopkins J, Ahuja N. Surgical comanagement by hospitalists improves patient outcomes: A propensity score analysis. Ann Surg. 2016;264(2):275-282. https://doi.org/10.1097/SLA.0000000000001629
6. Polverejan E, Gardiner JC, Bradley CJ, Holmes-Rovner M, Rovner D. Estimating mean hospital cost as a function of length of stay and patient characteristics. Health Econ. 2003;12(11):935-947. https://doi.org/10.1002/hec.774
7. Rohatgi N, Wei PH, Grujic O, Ahuja N. Surgical Comanagement by hospitalists in colorectal surgery. J Am Coll Surg. 2018;227(4):404-410. https://doi.org/10.1016/j.jamcollsurg.2018.06.011
8. Huddleston JM, Long KH, Naessens JM, et al. Medical and surgical comanagement after elective hip and knee arthroplasty: A randomized, controlled trial. Ann Intern Med. 2004;141(1):28-38. https://doi.org/10.7326/0003-4819-141-1-200407060-00012.
9. Swart E, Vasudeva E, Makhni EC, Macaulay W, Bozic KJ. Dedicated perioperative hip fracture comanagement programs are cost-effective in high-volume centers: An economic analysis. Clin Orthop Relat Res. 2016;474(1):222-233. https://doi.org/10.1007/s11999-015-4494-4.
10. Iberti CT, Briones A, Gabriel E, Dunn AS. Hospitalist-vascular surgery comanagement: Effects on complications and mortality. Hosp Pract. 2016;44(5):233-236. https://doi.org/10.1080/21548331.2016.1259543.
11. Kammerlander C, Roth T, Friedman SM, et al. Ortho-geriatric service--A literature review comparing different models. Osteoporos Int. 2010;21(Suppl 4):S637-S646. https://doi.org/10.1007/s00198-010-1396-x.
12. Bracey DN, Kiymaz TC, Holst DC, et al. An orthopedic-hospitalist comanaged hip fracture service reduces inpatient length of stay. Geriatr Orthop Surg Rehabil. 2016;7(4):171-177. https://doi.org/10.1177/2151458516661383.
13. Duplantier NL, Briski DC, Luce LT, Meyer MS, Ochsner JL, Chimento GF. The effects of a hospitalist comanagement model for joint arthroplasty patients in a teaching facility. J Arthroplasty. 2016;31(3):567-572. https://doi.org/10.1016/j.arth.2015.10.010.
14. Roy A, Heckman MG, Roy V. Associations between the hospitalist model of care and quality-of-care-related outcomes in patients undergoing hip fracture surgery. Mayo Clin Proc. 2006;81(1):28-31. https://doi.org/10.4065/81.1.28.
15. Godden E, Paseka A, Gnida J, Inguanzo J. The impact of response rate on Hospital Consumer Assessment of Healthcare Providers and System (HCAHPS) dimension scores. Patient Exp J. 2019;6(1):105-114. https://doi.org/10.35680/2372-0247.1357.
© 2020 Society of Hospital Medicine