User login
Research, in the field of Hospital Medicine, often leverages data collected for reasons other than research. For example, electronic medical record data or patient satisfaction survey results can be used to answer questions that are relevant to the practice of hospital medicine. In these types of datasets, data will inevitably be missing. Such missing data can compromise our ability to draw definitive conclusions from our research study. This review introduces the concept of missing data, describes patterns and mechanisms of missing data, and discusses common approaches for the handling of missing data, including sensitivity analyses for determining how robust the results are despite assumptions made about the missing data.
CONSEQUENCES OF MISSING DATA
Missing data create a host of problems for researchers. First, missing data result in a loss of information and can diminish the power of the proposed study. Second, the irregular data complicate the analysis because many of the standard software procedures used have been developed for fully observed or “complete” data (ie, each subject has a value for all measures of interest). Finally, missing data may introduce bias due to the systematic difference between the observed and the unobserved data. For example, if men are less likely than women to complete all questions in a patient satisfaction survey when they are not satisfied, then hospital satisfaction analyses that rely on completed surveys would tend to provide biased estimates of the satisfaction males have with their care.
MINIMIZING MISSING DATA WITH STUDY DESIGN
The ideal approach to mitigating problems caused by missing data is to anticipate and incorporate strategies to minimize missing data into the study design (ie, when planning data collection protocols for prospective studies). This plan should provide strategies for minimizing nonresponse and estimating the magnitude of anticipated missing data to ensure that the study achieves sufficient strength despite the missing data.
Strategies for minimizing nonresponse include (1) informing potential study participants, at initial contact, about the implications of missing data on the ability to answer the research question; (2) collecting several phone numbers, addresses, preferred method of contact and calling times, as well as an alternative contact, in case the primary study contact is unable to be reached; (3) specifying the number of call backs, as well as the time of contact; and (4) piloting data capture questions for phrasing, clarity, and sensitivity, in order to resolve problems before initiating the study. One approach that can be used to mitigate the impact of missing data in surveys is to contact a sample of the initial nonrespondents using a more intensive follow-up approach (eg, a nonresponse to a mailed survey is followed up by a telephone call in order to conduct the survey again over the phone), and this is referred to as “nonresponse two-phase sampling.” The additional data, captured in the second phase, not only reduces the nonresponse rate but can also provide important information on the missing data mechanism.1,2 In longitudinal studies with dropouts, one can measure participants’ intent to drop out in order to evaluate how much the probability of dropping out depends on missing responses.3 One may also choose to determine the power and implications of sample size under different missing data assumptions.4
UNDERSTANDING THE REASONS FOR MISSING DATA
Different data sources are likely to have unique reasons for missing values due to the workflows involved in how the data are collected. In research involving the use of data from electronic medical records, missing data on specific diagnoses involving patients who are regularly engaged in care are often considered to be “not present” or “normal”, since clinical documentation workflows are largely governed by the concept of “documentation by exception” in which diagnoses are documented only when there is an exception to the expectation that these are not present. For example, “diabetes mellitus” is commonly documented, but “diabetes mellitus not present” is rarely documented in electronic medical records which are used for clinical care. Thus, lack of explicit documentation is likely to indicate that diabetes mellitus is, in fact, not present.
Certain variables may be missing simply because there is no quantifiable value—ie, the data do not exist. Structural missingness refers to a value that does not exist for a logical reason (eg, “What is the gender of your first child?” for those who do not have a child). Censoring, which occurs during “time to event” analysis, refers to a situation where information about a subject stops before the event of interest happens, for example, when a subject in a study involving a 30-day outcome dies at day 14. The term “limit of detection” refers to the lowest or highest level at which two distinct values can reasonably be distinguished (eg, the lower limit of detection of a C-reactive protein assay may be 1 mg/dL, so lower values might simply be reported by the lab as <1 mg/dL).5 These types of missing data require specific methods that are not discussed in this review.
These examples illustrate that approaches to dealing with missing data vary depending on what data sources are used and how data are collected. Understanding the reasons missing data are present is a necessary step in formulating a robust analytic approach to handling missing data.
MISSING DATA PATTERNS AND MECHANISMS
Missing Data Patterns
Evaluating missing data patterns provides information on the degree and complexity of the missing data problem and can aid in choosing an appropriate missing data handling method. This is because some analytic methods work well for a general pattern (nonmonotone) and other methods work for special patterns (eg, monotone, file matching). In longitudinal studies, missing data is commonly missing in a monotone pattern, where once one variable is missing then all subsequent variables are also missing for a particular subject. This occurs when a study participant is lost to follow-up. For example, a monotone missing data pattern may occur in a study that requires a series of follow-up visits for laboratory blood tests. If a patient drops out, it results in a monotone missing data pattern, as no data on blood test results are available once the patient drops out. If the patient just skips an intermediate visit but returns for the final blood test, this would show a nonmonotone missing data pattern. A file-matching pattern occurs when variables are never observed together. This pattern can occur when data from several studies are merged and some variables are not collected in all studies. For example, three studies are merged and all three collect blood pressure, but only one study collects age and only one study collects sex.
Missing Data Mechanisms
The missing data mechanism relates to the underlying reasons for missing values and the relationships between variables with and without missing data. In general, missing data can be either random or nonrandom with distinctions in randomness made by three types: (1) data missing completely at random (MCAR); (2) data missing at random (MAR); and (3) data missing not at random (MNAR).6 As with the missing data pattern, understanding the missing data mechanism can aid in selecting an appropriate approach to handling the missing data.
Data are MCAR if the missingness does not depend on any study variables, meaning that all subjects are equally likely to be missing certain data elements. When the data are MCAR, those with missing values can be viewed as a simple random sample from the complete (but never actually observed) data and can be dropped from analysis without causing bias in the results. If the values of some diagnostic tests were missing for some patients due to equipment malfunction or electricity outage, for example, then the missingness may be considered MCAR.
Data are MAR if the missingness depends on the observed characteristics but not the unobserved characteristics, meaning that the relationships observed in the data can be used to predict the occurrence of missing values. Because the “randomness” of MAR is conditional on observed characteristics, which distinguishes it from the “completely at random” type of MCAR, dropping or omitting those cases with missing values from the analysis may lead to biased results.7 In a study of quality of life (QOL) for patients with mild to moderate traumatic brain injury, if health-related QOL questions were not answered by some patients with high pain levels (even though the pain levels were recorded), the missingness of QOL may be considered as MAR. This is due to the fact that within subjects grouped by the observed characteristic of pain (that is, conditional on similar levels of pain) the missingness of QOL is the result of chance and does not depend on the values (observed or unobserved) of QOL. It follows then, that once grouped into a high (or low) pain stratum, if QOL is considered MAR, then, whether or not it is observed, is random.
Data are considered MNAR if their missingness depends on characteristics that are not observed and cannot be fully explained by the observed characteristics. Systematic differences between missing and nonmissing data exist for data that is MNAR. For example, if a survey of household income had an increased probability of missing incomes from the low-income families then the data would be considered as MNAR.
Randomness in the missing data mechanism may be ignored without affecting the inference in some circumstances.8 Both MCAR and MAR can be considered as “ignorable” in the sense that a proper method (eg, multiple imputation) may recover the missing information without modeling (ie, accounting for) the random process of the missing data mechanism (Table).9 In contrast, the MNAR mechanism requires a method that takes into account the missing data mechanism in order to make inferences about the complete (and partially unobserved) data; or in other words, a model for the missing data mechanism cannot be ignored. It is for this reason that the MNAR mechanism is often called “nonignorable”. Nonignorable missing data present a challenge to researchers because the mechanism underlying the missingness must be included in the analysis. Yet researchers rarely know what the missingness mechanism is, and the data needed to validate any putative mechanism is, in fact, missing. In cases when more than one variable is subject to missingness, researchers need to assess the missingness mechanism for each variable and tailor their approach to the specific missing data problems.9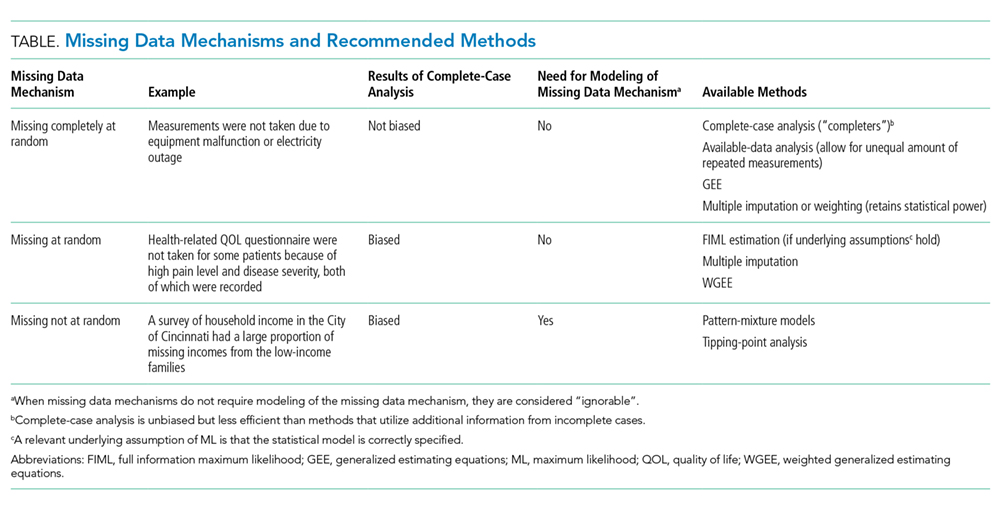
ANALYTIC APPROACHES
There is no universally accepted standard to guide when statistical methods should be applied to account for missing data. The amount of missing data alone cannot fully assess the missing data problem; missing data patterns and mechanisms can have greater impact on research results than the proportion of missing data alone. A good statistical method for handling missing data should provide an unbiased estimate of the quantity that the investigators intend to estimate; make use of the partial information in the incomplete cases to improve efficiency (and in most cases also to reduce bias); and provide valid estimates of the standard errors, confidence intervals, and P values for statistical tests. There are generally four broadly defined classes of methods for handling missing data in clinical research: (1) the complete-case analysis, (2) single imputation methods, (3) the weighted estimating-equation approach, and (4) the model-based approach including maximum likelihood (ML) and multiple imputation (Table and Appendix).10
Since missing data mechanisms cannot be conclusively verified, it is good practice to conduct some sensitivity analyses to test the robustness of the primary results. For this purpose, pattern-mixture models provide a flexible framework for implementing sensitivity analyses to missing data assumptions and can be used to evaluate the possibility of the data being MNAR. In this framework, the missing data distribution is modeled and then incorporated into the outcome model of interest. Tipping-point analysis is a sensitivity analysis where the missing data is replaced with a range of values to determine how much the values must change for the results of the study to tip from significant to not significant. If the same general conclusions remain valid over a range of assumptions about the missing data values, then one can have greater confidence in the study conclusions.
SUMMARY AND RECOMMENDATIONS
In dealing with missing data from clinical research, clinicians and statisticians need to work together to minimize missingness at the data collection stage, document the reasons for missingness, use substantive knowledge, if possible, to assess the missing data mechanism, perform primary analysis based on a defensible missing data mechanism, and conduct a sensitivity analysis to assess whether the primary result is robust despite departure from the assumed missing data mechanism.
Acknowledgments
The following members of the Journal of Hospital Medicine Leadership team contributed to this review: Mel L. Anderson, MD; Peter Cram, MD, MBA; JoAnna K. Leyenaar, MD, PhD, MPH; Brian P. Lucas, MD, MS; Oanh Nguyen, MD, MAS; Samir S. Shah, MD, MSCE; Erin E. Shaughnessy, MD, MSHCM; and Heidi J. Sucharew, PhD.
1. Zhang N, Chen H, Elliott MR. Nonrespondent subsample multiple imputation in two-phase sampling for nonresponse. J Off Stat. 2016;32(3):769-785. https://doi.org/10.1515/jos-2016-0039
2. Zhang Y, Chen H, Zhang N. Bayesian inference for nonresponse two-phase sampling. Stat Sin. 2018;28(4):2167-2187. https://doi.org/10.5705/ss.202017.0016
3. Demirtas H, Schafer JL. On the performance of random-coefficient pattern-mixture models for non-ignorable drop-out. Stat Med. 2003;22(16):2553-2575. https://doi.org/10.1002/sim.1475
4. Davey A, Savla J. Estimating statistical power with incomplete data. Org Res Methods. 2009;12(2):320-346. https://doi.org/10.1177/1094428107300366
5. Harel O, Perkins N, Schisterman EF. The use of multiple imputation for data subject to limits of detection. Sri Lankan J Appl Stat. 2014;5(4):227. https://doi.org/10.4038/sljastats.v5i4.7792
6. Rubin DB. Inference and missing data. Biometrika. 1976;63(3):581-592. https://doi.org/10.2307/2335739
7. Van der Heijden GJ, Donders ART, Stijnen T, Moons KG. Imputation of missing values is superior to complete case analysis and the missing-indicator method in multivariable diagnostic research: a clinical example. J Clin Epidemiol.2006;59(10):1102-1109. https://doi.org/10.1016/j.jclinepi.2006.01.015
8. Little RJ, Rubin DB. Statistical analysis with missing data: Wiley; 2019. Hoboken, New Jersey.
9. Little RJ, Zhang N. Subsample ignorable likelihood for regression analysis with missing data. J Royal Stat Soc. 2011;60(4):591-605. https://doi.org/10.1111/j.1467-9876.2011.00763.x
10. Little RJ, D’agostino R, Cohen ML, et al. The prevention and treatment of missing data in clinical trials. N Engl J Med. 2012;367(14):1355-1360. https://doi.org/10.1056/NEJMsr1203730
11. Little RJ, Rubin DB. Single imputation methods. Statistical analysis with missing data 2002:59-74. Hoboken, New Jersey.
12. Seaman SR, White IR. Review of inverse probability weighting for dealing with missing data. Stat Methods Med Res. 2013;22(3):278-295. https://doi.org/10.1177/0962280210395740
13. Han P. Multiply robust estimation in regression analysis with missing data. J Am Stat Assoc. 2014;109(504):1159-1173. https://doi.org/10.1080/01621459.2014.880058
14. Yucel RM. State of the multiple imputation software. J Stat Softw. 2011;45(1). https://doi.org/10.18637/jss.v045.i01
Research, in the field of Hospital Medicine, often leverages data collected for reasons other than research. For example, electronic medical record data or patient satisfaction survey results can be used to answer questions that are relevant to the practice of hospital medicine. In these types of datasets, data will inevitably be missing. Such missing data can compromise our ability to draw definitive conclusions from our research study. This review introduces the concept of missing data, describes patterns and mechanisms of missing data, and discusses common approaches for the handling of missing data, including sensitivity analyses for determining how robust the results are despite assumptions made about the missing data.
CONSEQUENCES OF MISSING DATA
Missing data create a host of problems for researchers. First, missing data result in a loss of information and can diminish the power of the proposed study. Second, the irregular data complicate the analysis because many of the standard software procedures used have been developed for fully observed or “complete” data (ie, each subject has a value for all measures of interest). Finally, missing data may introduce bias due to the systematic difference between the observed and the unobserved data. For example, if men are less likely than women to complete all questions in a patient satisfaction survey when they are not satisfied, then hospital satisfaction analyses that rely on completed surveys would tend to provide biased estimates of the satisfaction males have with their care.
MINIMIZING MISSING DATA WITH STUDY DESIGN
The ideal approach to mitigating problems caused by missing data is to anticipate and incorporate strategies to minimize missing data into the study design (ie, when planning data collection protocols for prospective studies). This plan should provide strategies for minimizing nonresponse and estimating the magnitude of anticipated missing data to ensure that the study achieves sufficient strength despite the missing data.
Strategies for minimizing nonresponse include (1) informing potential study participants, at initial contact, about the implications of missing data on the ability to answer the research question; (2) collecting several phone numbers, addresses, preferred method of contact and calling times, as well as an alternative contact, in case the primary study contact is unable to be reached; (3) specifying the number of call backs, as well as the time of contact; and (4) piloting data capture questions for phrasing, clarity, and sensitivity, in order to resolve problems before initiating the study. One approach that can be used to mitigate the impact of missing data in surveys is to contact a sample of the initial nonrespondents using a more intensive follow-up approach (eg, a nonresponse to a mailed survey is followed up by a telephone call in order to conduct the survey again over the phone), and this is referred to as “nonresponse two-phase sampling.” The additional data, captured in the second phase, not only reduces the nonresponse rate but can also provide important information on the missing data mechanism.1,2 In longitudinal studies with dropouts, one can measure participants’ intent to drop out in order to evaluate how much the probability of dropping out depends on missing responses.3 One may also choose to determine the power and implications of sample size under different missing data assumptions.4
UNDERSTANDING THE REASONS FOR MISSING DATA
Different data sources are likely to have unique reasons for missing values due to the workflows involved in how the data are collected. In research involving the use of data from electronic medical records, missing data on specific diagnoses involving patients who are regularly engaged in care are often considered to be “not present” or “normal”, since clinical documentation workflows are largely governed by the concept of “documentation by exception” in which diagnoses are documented only when there is an exception to the expectation that these are not present. For example, “diabetes mellitus” is commonly documented, but “diabetes mellitus not present” is rarely documented in electronic medical records which are used for clinical care. Thus, lack of explicit documentation is likely to indicate that diabetes mellitus is, in fact, not present.
Certain variables may be missing simply because there is no quantifiable value—ie, the data do not exist. Structural missingness refers to a value that does not exist for a logical reason (eg, “What is the gender of your first child?” for those who do not have a child). Censoring, which occurs during “time to event” analysis, refers to a situation where information about a subject stops before the event of interest happens, for example, when a subject in a study involving a 30-day outcome dies at day 14. The term “limit of detection” refers to the lowest or highest level at which two distinct values can reasonably be distinguished (eg, the lower limit of detection of a C-reactive protein assay may be 1 mg/dL, so lower values might simply be reported by the lab as <1 mg/dL).5 These types of missing data require specific methods that are not discussed in this review.
These examples illustrate that approaches to dealing with missing data vary depending on what data sources are used and how data are collected. Understanding the reasons missing data are present is a necessary step in formulating a robust analytic approach to handling missing data.
MISSING DATA PATTERNS AND MECHANISMS
Missing Data Patterns
Evaluating missing data patterns provides information on the degree and complexity of the missing data problem and can aid in choosing an appropriate missing data handling method. This is because some analytic methods work well for a general pattern (nonmonotone) and other methods work for special patterns (eg, monotone, file matching). In longitudinal studies, missing data is commonly missing in a monotone pattern, where once one variable is missing then all subsequent variables are also missing for a particular subject. This occurs when a study participant is lost to follow-up. For example, a monotone missing data pattern may occur in a study that requires a series of follow-up visits for laboratory blood tests. If a patient drops out, it results in a monotone missing data pattern, as no data on blood test results are available once the patient drops out. If the patient just skips an intermediate visit but returns for the final blood test, this would show a nonmonotone missing data pattern. A file-matching pattern occurs when variables are never observed together. This pattern can occur when data from several studies are merged and some variables are not collected in all studies. For example, three studies are merged and all three collect blood pressure, but only one study collects age and only one study collects sex.
Missing Data Mechanisms
The missing data mechanism relates to the underlying reasons for missing values and the relationships between variables with and without missing data. In general, missing data can be either random or nonrandom with distinctions in randomness made by three types: (1) data missing completely at random (MCAR); (2) data missing at random (MAR); and (3) data missing not at random (MNAR).6 As with the missing data pattern, understanding the missing data mechanism can aid in selecting an appropriate approach to handling the missing data.
Data are MCAR if the missingness does not depend on any study variables, meaning that all subjects are equally likely to be missing certain data elements. When the data are MCAR, those with missing values can be viewed as a simple random sample from the complete (but never actually observed) data and can be dropped from analysis without causing bias in the results. If the values of some diagnostic tests were missing for some patients due to equipment malfunction or electricity outage, for example, then the missingness may be considered MCAR.
Data are MAR if the missingness depends on the observed characteristics but not the unobserved characteristics, meaning that the relationships observed in the data can be used to predict the occurrence of missing values. Because the “randomness” of MAR is conditional on observed characteristics, which distinguishes it from the “completely at random” type of MCAR, dropping or omitting those cases with missing values from the analysis may lead to biased results.7 In a study of quality of life (QOL) for patients with mild to moderate traumatic brain injury, if health-related QOL questions were not answered by some patients with high pain levels (even though the pain levels were recorded), the missingness of QOL may be considered as MAR. This is due to the fact that within subjects grouped by the observed characteristic of pain (that is, conditional on similar levels of pain) the missingness of QOL is the result of chance and does not depend on the values (observed or unobserved) of QOL. It follows then, that once grouped into a high (or low) pain stratum, if QOL is considered MAR, then, whether or not it is observed, is random.
Data are considered MNAR if their missingness depends on characteristics that are not observed and cannot be fully explained by the observed characteristics. Systematic differences between missing and nonmissing data exist for data that is MNAR. For example, if a survey of household income had an increased probability of missing incomes from the low-income families then the data would be considered as MNAR.
Randomness in the missing data mechanism may be ignored without affecting the inference in some circumstances.8 Both MCAR and MAR can be considered as “ignorable” in the sense that a proper method (eg, multiple imputation) may recover the missing information without modeling (ie, accounting for) the random process of the missing data mechanism (Table).9 In contrast, the MNAR mechanism requires a method that takes into account the missing data mechanism in order to make inferences about the complete (and partially unobserved) data; or in other words, a model for the missing data mechanism cannot be ignored. It is for this reason that the MNAR mechanism is often called “nonignorable”. Nonignorable missing data present a challenge to researchers because the mechanism underlying the missingness must be included in the analysis. Yet researchers rarely know what the missingness mechanism is, and the data needed to validate any putative mechanism is, in fact, missing. In cases when more than one variable is subject to missingness, researchers need to assess the missingness mechanism for each variable and tailor their approach to the specific missing data problems.9
ANALYTIC APPROACHES
There is no universally accepted standard to guide when statistical methods should be applied to account for missing data. The amount of missing data alone cannot fully assess the missing data problem; missing data patterns and mechanisms can have greater impact on research results than the proportion of missing data alone. A good statistical method for handling missing data should provide an unbiased estimate of the quantity that the investigators intend to estimate; make use of the partial information in the incomplete cases to improve efficiency (and in most cases also to reduce bias); and provide valid estimates of the standard errors, confidence intervals, and P values for statistical tests. There are generally four broadly defined classes of methods for handling missing data in clinical research: (1) the complete-case analysis, (2) single imputation methods, (3) the weighted estimating-equation approach, and (4) the model-based approach including maximum likelihood (ML) and multiple imputation (Table and Appendix).10
Since missing data mechanisms cannot be conclusively verified, it is good practice to conduct some sensitivity analyses to test the robustness of the primary results. For this purpose, pattern-mixture models provide a flexible framework for implementing sensitivity analyses to missing data assumptions and can be used to evaluate the possibility of the data being MNAR. In this framework, the missing data distribution is modeled and then incorporated into the outcome model of interest. Tipping-point analysis is a sensitivity analysis where the missing data is replaced with a range of values to determine how much the values must change for the results of the study to tip from significant to not significant. If the same general conclusions remain valid over a range of assumptions about the missing data values, then one can have greater confidence in the study conclusions.
SUMMARY AND RECOMMENDATIONS
In dealing with missing data from clinical research, clinicians and statisticians need to work together to minimize missingness at the data collection stage, document the reasons for missingness, use substantive knowledge, if possible, to assess the missing data mechanism, perform primary analysis based on a defensible missing data mechanism, and conduct a sensitivity analysis to assess whether the primary result is robust despite departure from the assumed missing data mechanism.
Acknowledgments
The following members of the Journal of Hospital Medicine Leadership team contributed to this review: Mel L. Anderson, MD; Peter Cram, MD, MBA; JoAnna K. Leyenaar, MD, PhD, MPH; Brian P. Lucas, MD, MS; Oanh Nguyen, MD, MAS; Samir S. Shah, MD, MSCE; Erin E. Shaughnessy, MD, MSHCM; and Heidi J. Sucharew, PhD.
1. Zhang N, Chen H, Elliott MR. Nonrespondent subsample multiple imputation in two-phase sampling for nonresponse. J Off Stat. 2016;32(3):769-785. https://doi.org/10.1515/jos-2016-0039
2. Zhang Y, Chen H, Zhang N. Bayesian inference for nonresponse two-phase sampling. Stat Sin. 2018;28(4):2167-2187. https://doi.org/10.5705/ss.202017.0016
3. Demirtas H, Schafer JL. On the performance of random-coefficient pattern-mixture models for non-ignorable drop-out. Stat Med. 2003;22(16):2553-2575. https://doi.org/10.1002/sim.1475
4. Davey A, Savla J. Estimating statistical power with incomplete data. Org Res Methods. 2009;12(2):320-346. https://doi.org/10.1177/1094428107300366
5. Harel O, Perkins N, Schisterman EF. The use of multiple imputation for data subject to limits of detection. Sri Lankan J Appl Stat. 2014;5(4):227. https://doi.org/10.4038/sljastats.v5i4.7792
6. Rubin DB. Inference and missing data. Biometrika. 1976;63(3):581-592. https://doi.org/10.2307/2335739
7. Van der Heijden GJ, Donders ART, Stijnen T, Moons KG. Imputation of missing values is superior to complete case analysis and the missing-indicator method in multivariable diagnostic research: a clinical example. J Clin Epidemiol.2006;59(10):1102-1109. https://doi.org/10.1016/j.jclinepi.2006.01.015
8. Little RJ, Rubin DB. Statistical analysis with missing data: Wiley; 2019. Hoboken, New Jersey.
9. Little RJ, Zhang N. Subsample ignorable likelihood for regression analysis with missing data. J Royal Stat Soc. 2011;60(4):591-605. https://doi.org/10.1111/j.1467-9876.2011.00763.x
10. Little RJ, D’agostino R, Cohen ML, et al. The prevention and treatment of missing data in clinical trials. N Engl J Med. 2012;367(14):1355-1360. https://doi.org/10.1056/NEJMsr1203730
11. Little RJ, Rubin DB. Single imputation methods. Statistical analysis with missing data 2002:59-74. Hoboken, New Jersey.
12. Seaman SR, White IR. Review of inverse probability weighting for dealing with missing data. Stat Methods Med Res. 2013;22(3):278-295. https://doi.org/10.1177/0962280210395740
13. Han P. Multiply robust estimation in regression analysis with missing data. J Am Stat Assoc. 2014;109(504):1159-1173. https://doi.org/10.1080/01621459.2014.880058
14. Yucel RM. State of the multiple imputation software. J Stat Softw. 2011;45(1). https://doi.org/10.18637/jss.v045.i01
© 2019 Society of Hospital Medicine