User login
The benefits of glycemic control include decreased patient morbidity, mortality, length of stay, and reduced hospital costs. In 2004, the American College of Endocrinology (ACE) issued glycemic guidelines for non‐critical‐care units (fasting glucose <110 mg/dL, nonfasting glucose <180 mg/dL).1 A comprehensive review of inpatient glycemic management called for development and evaluation of inpatient programs and tools.2 The 2006 ACE/American Diabetes Association (ADA) Statement on Inpatient Diabetes and Glycemic Control identified key components of an inpatient glycemic control program as: (1) solid administrative support; (2) a multidisciplinary committee; (3) assessment of current processes, care, and barriers; (4) development and implementation of order sets, protocols, policies, and educational efforts; and (5) metrics for evaluation.3
In 2003, Harborview Medical Center (HMC) formed a multidisciplinary committee to institute a Glycemic Control Program. The early goals were to decrease the use of sliding‐scale insulin, increase the appropriate use of basal and prandial insulin, and to avoid hypoglycemia. Here we report our program design and trends in physician insulin ordering from 2003 through 2006.
Patients and Methods
Setting
Seattle's HMC is a 400‐bed level‐1 regional trauma center managed by the University of Washington. The hospital's mission includes serving at‐risk populations. Based on illness, the University HealthSystem Consortium (UHC) assigns HMC the highest predicted mortality among its 131 affiliated hospitals nationwide.4
Patients
We included all patients hospitalized in non‐critical‐care wardsmedical, surgical, and psychiatric. Patients were categorized as dysglycemic if they: (1) received subcutaneous insulin or oral diabetic medications; or (2) had any single glucose level outside the normal range of 125 mg/dL or <60 mg/dL. Patients not meeting these criteria were classified as euglycemic. Approval was obtained from the University of Washington Human Subjects Review Committee.
Program Description
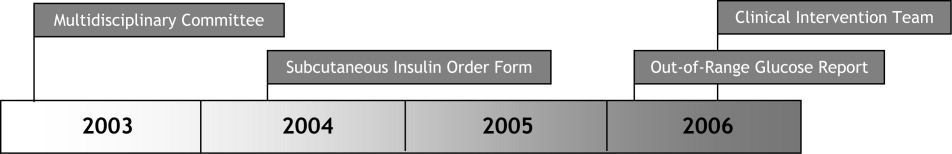
Since 2003, the multidisciplinary committeephysicians, nurses, pharmacy representatives, and dietary and administrative representativeshas directed the development of the Glycemic Control Program with support from hospital administration and the Department of Quality Improvement. Funding for this program has been provided by the hospital based on the prominence of glycemic control among quality and safety measures, a projected decrease in costs, and the high incidence of diabetes in our patient population. Figure 1 outlines the program's key interventions.

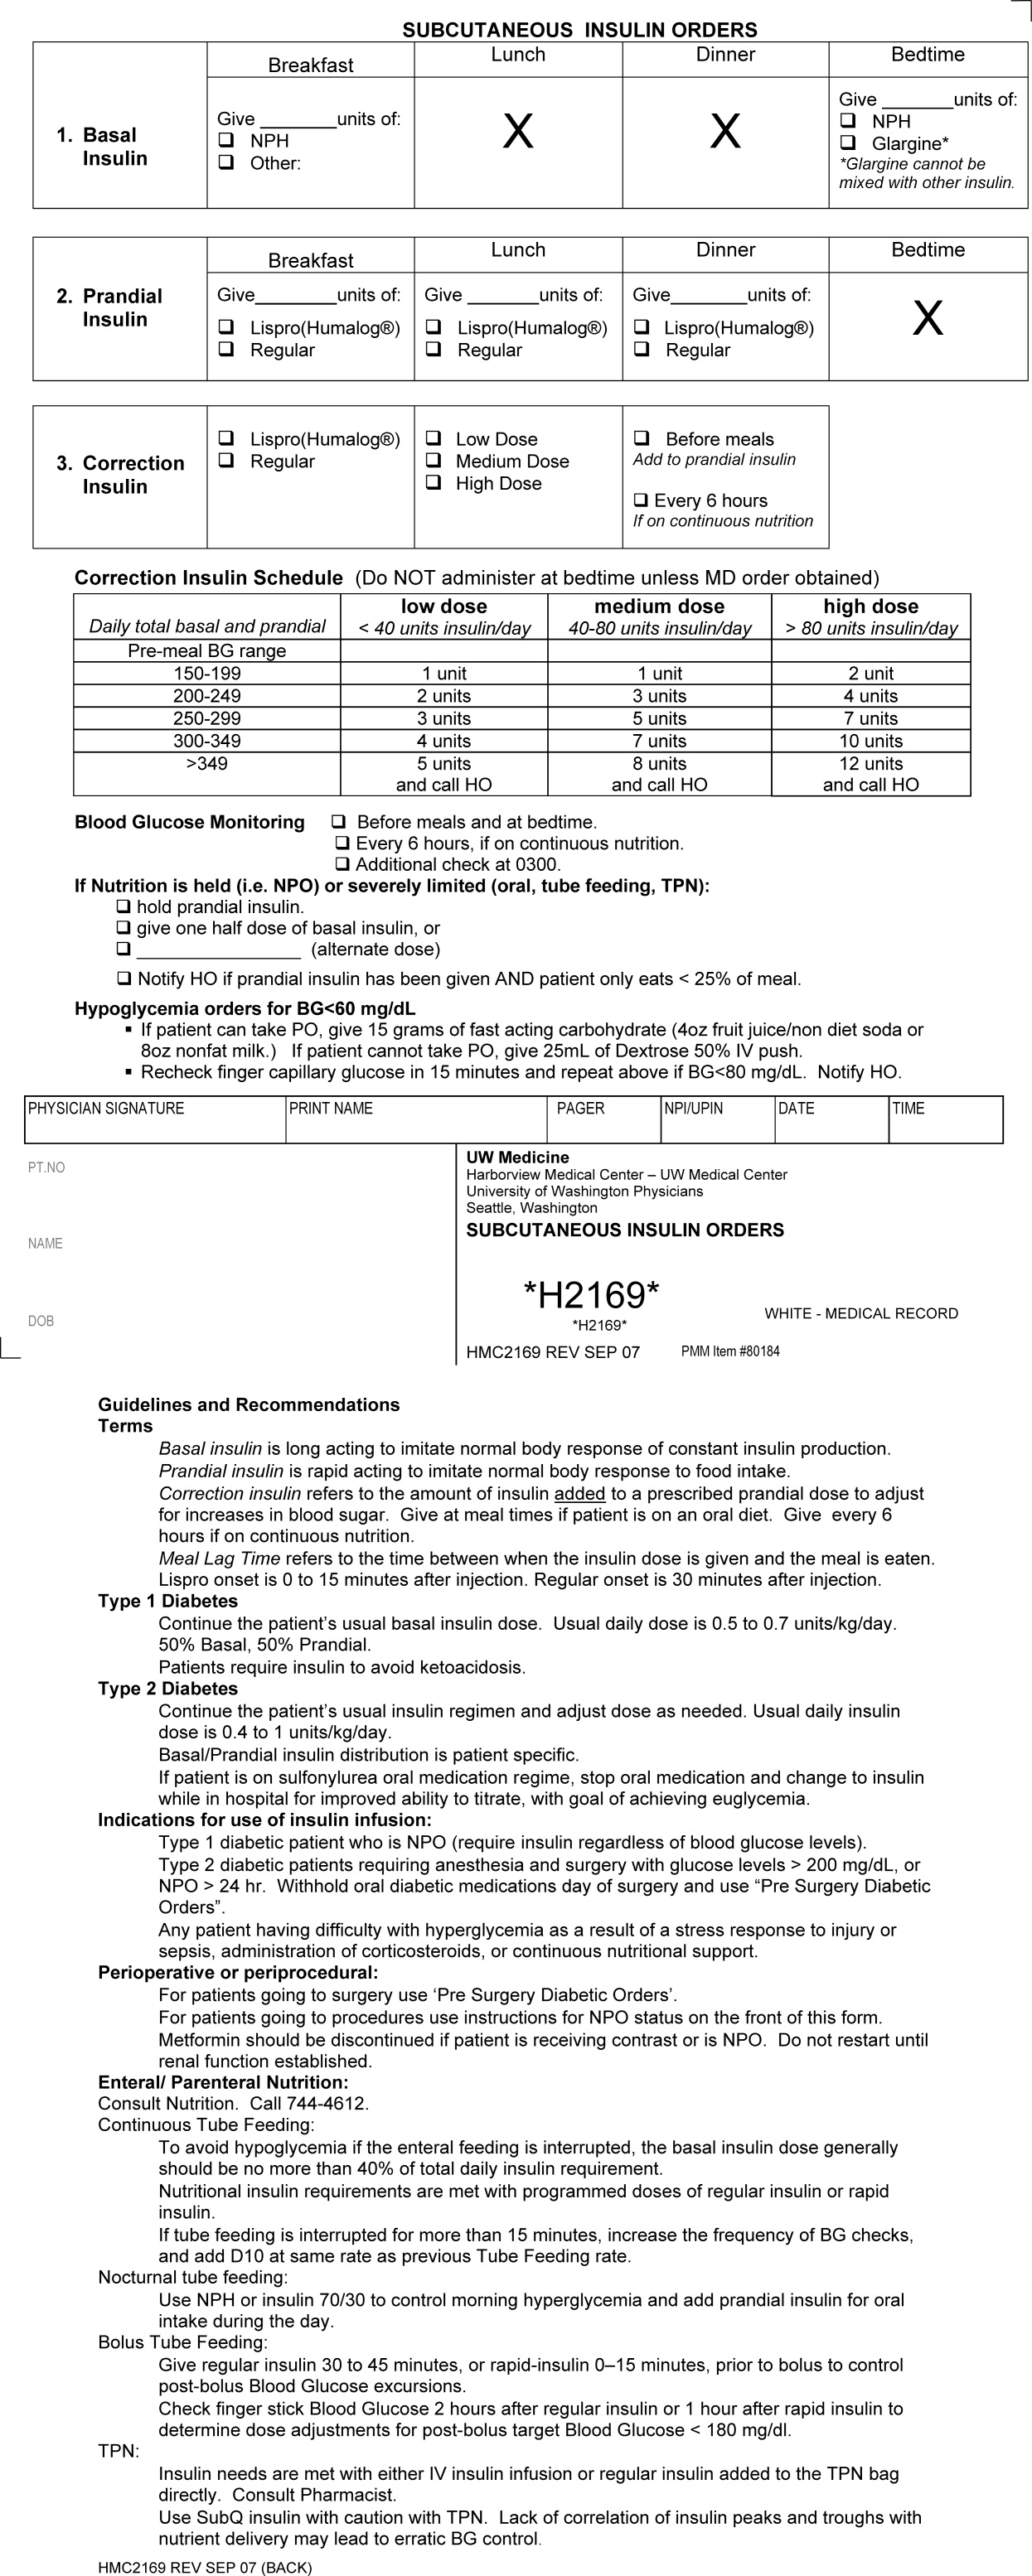
First, a Subcutaneous Insulin Order Form was released for elective use in May 2004 (Figure 2). This form incorporated the 3 components of quality insulin ordering (basal, scheduled prandial, and prandial correction dosing) and provides prompts and education. A Diabetes Nurse Specialist trained nursing staff on the use of the form.
Second, we developed an automated daily data report identifying patients with out‐of‐range glucose levels defined as having any single glucose readings <60 mg/dL or any 2 readings 180 mg/dL within the prior 24 hours. In February 2006, this daily report became available to the clinicians on the committee.
Third, the Glycemic Control Program recruited a full‐time clinical Advanced Registered Nurse Practitioner (ARNP) and part‐time supervising physician to provide directed intervention and education for patients and medical personnel. Since August 2006, the ARNP has reviewed the out‐of‐range report daily, performs assessments, refines insulin orders, and educates clinicians. The assessments include chart review (of history and glycemic control), discussion with primary physician and nurse (and often the dietician), and interview of the patient and/or family. This leads to development and implementation of a glycemic control plan. Clinician education is performed both as direct education of the primary physician at the time of intervention and as didactic sessions.
Outcomes
Physician Insulin Ordering
The numbers of patients receiving basal and short‐acting insulin were identified from the electronic medication record. Basal insulin included glargine and neutral protamine Hagerdorn (NPH). Short‐acting insulin (lispro or regular) could be ordered as scheduled prandial, prandial correction, or sliding scale. The distinction between prandial correction and sliding scale is that correction precedes meals exclusively and is not intended for use without food; in contrast, sliding scale is given regardless of food being consumed and is considered substandard. Quality insulin ordering is defined as having basal, prandial scheduled, and prandial correction doses.
In the electronic record, however, we were unable to distinguish the intent of short‐acting insulin orders in the larger data set. Thus, we reviewed a subset of 100 randomly selected charts (25 from each year from 2003 through 2006) to differentiate scheduled prandial, prandial correction, and sliding scale.
Hyperglycemia
Hyperglycemia was defined as glucose 180 mg/dL. The proportion of dysglycemic patients with hyperglycemia was calculated daily as the percent of dysglycemic patients with any 2 glucose levels 180 mg/dL. Daily values were averaged for quarterly measures.
Hypoglycemia
Hypoglycemia was defined as glucose <60 mg/dL. The proportion of all dysglycemic patients with hypoglycemia was calculated daily as the percent of dysglycemic patients with a single glucose level of <60 mg/dL. Daily values were averaged for quarterly measures.
Data Collection
Data were retrieved from electronic medical records, hospital administrative decision support, and risk‐adjusted5 UHC clinical database information. Glucose data were obtained from laboratory records (venous) and nursing data from bedside chemsticks (capillary).
Statistical Analyses
Data were analyzed using SAS 9.1 (SAS Institute, Cary, NC) and SPSS 13.0 (SPSS, Chicago, IL). The mean and standard deviation (SD) for continuous variables and proportions for categorical variables were calculated. Data were examined, plotted, and trended over time. Where applicable, linear regression trend lines were fitted and tested for statistical significance (P value <0.05).
Results
Patients
In total, 44,225 patients were identified from January 1, 2003 through December 31, 2006; 18,087 patients (41%) were classified as dysglycemic as defined by either: (1) receiving insulin or oral diabetic medicine; or (2) having a glucose level 125 mg/dL or <60 mg/dL. Characteristics of the population are outlined in Table 1. Both groups shared similar ethnic distributions. Across all 4 years, dysglycemic patients tended to be older and have a higher severity of illness. As an additional descriptor of severity of illness, UHC mean expected length of stay (LOS) and mean expected mortality (risk‐adjusted5) were higher for dysglycemic patients.
| Dysglycemic | Euglycemic | |
|---|---|---|
| ||
| Number of patients | 18,088 | 26,144 |
| Age (years, mean SD) | 48.4 20.3 | 41.3 18.3 |
| Gender, male (%) | 64.7 | 62.7 |
| Ethnicity (%) | ||
| Caucasian | 68.2 | 70.1 |
| African‐American/Black | 11.0 | 12.0 |
| Hispanic | 6.8 | 6.2 |
| Native American | 1.8 | 18 |
| Asian | 7.9 | 5.5 |
| Unknown | 4.3 | 4.4 |
| UHC severity of illness index (%) | ||
| Minor | 18.3 | 38.8 |
| Moderate | 35.4 | 40.8 |
| Major | 29.5 | 16.7 |
| Extreme | 16.9 | 3.6 |
| UHC expected LOS (days, mean SD)* | 7.8 6.9 | 5.2 4.1 |
| UHC expected mortality (mean SD)* | 0.06 0.13 | 0.01 0.06 |
Physician Insulin Ordering
Ordering of both short‐acting and basal insulin increased (Figure 3). The ratio of short‐acting to basal orders decreased from 3.36 (1668/496) in 2003 to 1.97 (2226/1128) in 2006.
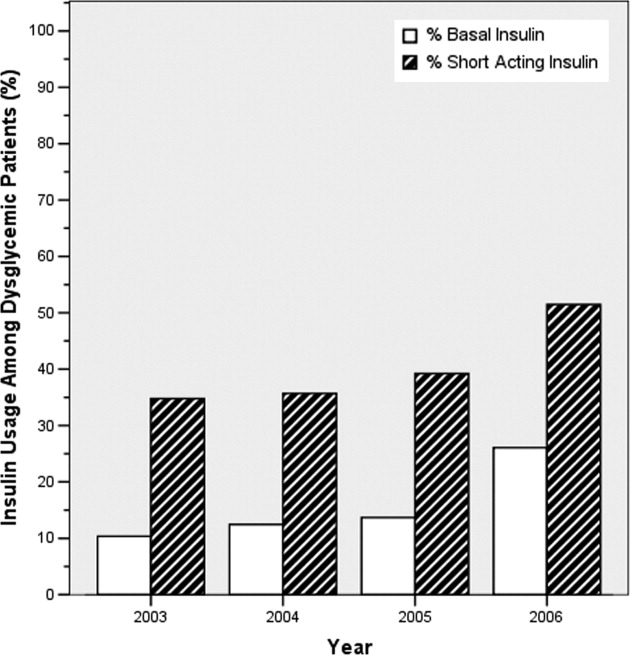
Chart review of the 100 randomly selected dysglycemic patients revealed increased ordering of prandial correction dosing from 8% of patients in 2003 to 32% in 2006. Yet, only 1 patient in 2003 and only 2 in 2006 had scheduled prandial. Ordering of sliding scale insulin fell from 16% in 2003 to 4% in 2006.
Glycemic Control Outcomes
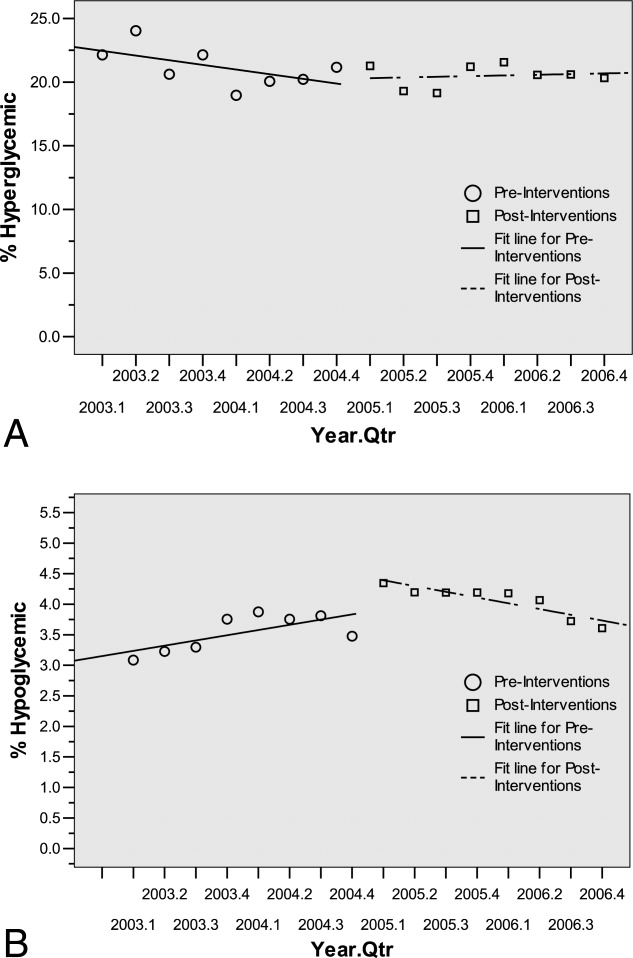
The percentage of dysglycemic patients with hyperglycemia ranged from 19 to 24 without significant decline over the 4 years (Figure 4A). The percentage of hypoglycemic dysglycemic patients was increasing from 2003 to 2004, but in the years following the interventions (2005 through 2006) this declined significantly (P = 0.003; Figure 4B). On average, the observed LOS was higher for dysglycemic vs. euglycemic patients (mean SD days: 9.4 12.2 and 5.8 8.5, respectively). The mean observed to expected mortality ratio was 0.45 0.08 and 0.44 0.17 for the dysglycemic and euglycemic patients, respectively. Over the 4 years no statistically significant change in observed LOS or adjusted mortality was found (data not shown).
Conclusions
HMC, a safety net hospital with the highest UHC expected mortality of 131 hospitals nationwide, has demonstrated early successes in building its Glycemic Control Program, including: (1) decreased prescription of sliding scale; (2) a marked increase in prescription of basal insulin; and (3) significantly decreasing hypoglycemic events subsequent to the interventions. The decreased sliding scale and increased overall ordering of insulin could reflect increased awareness brought internationally through the literature and locally through our program. Two distinctive aspects of HMC's Glycemic Control Program, when compared to others,68 include: (1) the daily use of real‐time data to identify and target patients with out‐of‐range glucose levels; and (2) the coverage of all non‐critical‐care floors with a single clinician.
In 2003 and 2004, the increasing hypoglycemia we observed paralleled the international focus on aggressively treating hyperglycemia in the acute care setting. We observed a significant decrease in hypoglycemia in 2005 and 2006 that could be attributed to the education provided by the Glycemic Control Program and 2 features on the subcutaneous insulin order set: the prominent hypoglycemia protocol and the order hold prandial insulin if the patient cannot eat. These are similar features identified in a report on preventing hospital hypoglycemia.9 Additionally, hypoglycemia may have decreased secondary to the emphasis on not using short‐acting insulin at bedtime.
Despite increased and improved insulin ordering, we did not observe a significant change in the percent of dysglycemic patients with 2 glucose levels 180 mg/dL. In our program patients are identified for intervention after their glucose levels are out‐of‐range. To better evaluate the impact of our interventions on the glycemic control of each patient, we plan to analyze the glucose levels in the days following identification of patients. Alternatively, we could provide intervention to all patients with dysglycemia rather than waiting for glucoses to be out‐of‐range. Though this approach would require greater resources than the single clinician we currently employ.
Our early experience highlights areas for future evaluation and intervention. First, the lack of scheduled prandial insulin and that less than one‐third of dysglycemic patients have basal insulin ordered underscore a continued need to target quality insulin ordering to include all componentsbasal, scheduled prandial, and prandial correction. Second, while the daily report is a good rudimentary identification tool for at‐risk patients, it offers limited information as to the impact of our clinical intervention. Thus, refined evaluative metrics need be developed to prospectively assess the course of glycemic control for patients.
We acknowledge the limitations of this study. First, our most involved interventionthe addition of the clinical intervention teamcame only 6 months before the end of the study period. Second, this is an observational retrospective analysis and cannot distinguish confounders, such as physician preferences and decisions, that not easily quantified or controlled for. Third, our definition of dysglycemic incorporated 41% of non‐critical‐care patients, possibly reflecting too broad a definition.
In summary, we have described an inpatient Glycemic Control Program that relies on real‐time data to identify patients in need of intervention. Early in our program we observed improved insulin ordering quality and decreased rates of hypoglycemia. Future steps include evaluating the impact of our clinical intervention team and further refining glycemic control metrics to prospectively identify patients at risk for hyper‐ and hypoglycemia.
Acknowledgements
The authors thank Sofia Medvedev (UHC) and Derk B. Adams (HMC QI). The information contained in this article was based in part on the Clinical Data Products Data Base maintained by the UHC.
- ,,, et al.American College of Endocrinology position statement on inpatient diabetes and metabolic control.Endocr Pract.2004;10(suppl 2):4–9.
- ,,, et al.Management of diabetes and hyperglycemia in hospitals.Diabetes Care.2004;27:553–591.
- American College of Endocrinology and American Diabetes Association Consensus statement on inpatient diabetes and glycemic control.Diabetes Care.2006;29:1955–1962.
- University HealthSystem Consortium Mortality. Confidential Clinical Outcomes Report. Available at: http://www.uhc.edu. Accessed August2009 (Access with UHC permission only).
- Mortality risk adjustment for University HealthSystem Consortium's Clinical database. Available at: http://www.ahrq.gov/qual/mortality/Meurer.pdf. Accessed August2009.
- ,,, et al.Inpatient management of hyperglycemia: the Northwestern experience.Endocr Pract.2006;12:491–505.
- ,,,,.Evolution of a diabetes inpatient safety committee.Endocr Pract.2006;12(suppl 3):91–99.
- ,.Financial implications of glycemic control: results of an inpatient diabetes management program.Endocr Pract.2006;12(suppl 3):43–48.
- ,,, et al.Hospital hypoglycemia: not only treatment but also prevention.Endocr Pract.2004;10(suppl 2):89–99.
The benefits of glycemic control include decreased patient morbidity, mortality, length of stay, and reduced hospital costs. In 2004, the American College of Endocrinology (ACE) issued glycemic guidelines for non‐critical‐care units (fasting glucose <110 mg/dL, nonfasting glucose <180 mg/dL).1 A comprehensive review of inpatient glycemic management called for development and evaluation of inpatient programs and tools.2 The 2006 ACE/American Diabetes Association (ADA) Statement on Inpatient Diabetes and Glycemic Control identified key components of an inpatient glycemic control program as: (1) solid administrative support; (2) a multidisciplinary committee; (3) assessment of current processes, care, and barriers; (4) development and implementation of order sets, protocols, policies, and educational efforts; and (5) metrics for evaluation.3
In 2003, Harborview Medical Center (HMC) formed a multidisciplinary committee to institute a Glycemic Control Program. The early goals were to decrease the use of sliding‐scale insulin, increase the appropriate use of basal and prandial insulin, and to avoid hypoglycemia. Here we report our program design and trends in physician insulin ordering from 2003 through 2006.
Patients and Methods
Setting
Seattle's HMC is a 400‐bed level‐1 regional trauma center managed by the University of Washington. The hospital's mission includes serving at‐risk populations. Based on illness, the University HealthSystem Consortium (UHC) assigns HMC the highest predicted mortality among its 131 affiliated hospitals nationwide.4
Patients
We included all patients hospitalized in non‐critical‐care wardsmedical, surgical, and psychiatric. Patients were categorized as dysglycemic if they: (1) received subcutaneous insulin or oral diabetic medications; or (2) had any single glucose level outside the normal range of 125 mg/dL or <60 mg/dL. Patients not meeting these criteria were classified as euglycemic. Approval was obtained from the University of Washington Human Subjects Review Committee.
Program Description
Since 2003, the multidisciplinary committeephysicians, nurses, pharmacy representatives, and dietary and administrative representativeshas directed the development of the Glycemic Control Program with support from hospital administration and the Department of Quality Improvement. Funding for this program has been provided by the hospital based on the prominence of glycemic control among quality and safety measures, a projected decrease in costs, and the high incidence of diabetes in our patient population. Figure 1 outlines the program's key interventions.
First, a Subcutaneous Insulin Order Form was released for elective use in May 2004 (Figure 2). This form incorporated the 3 components of quality insulin ordering (basal, scheduled prandial, and prandial correction dosing) and provides prompts and education. A Diabetes Nurse Specialist trained nursing staff on the use of the form.
Second, we developed an automated daily data report identifying patients with out‐of‐range glucose levels defined as having any single glucose readings <60 mg/dL or any 2 readings 180 mg/dL within the prior 24 hours. In February 2006, this daily report became available to the clinicians on the committee.
Third, the Glycemic Control Program recruited a full‐time clinical Advanced Registered Nurse Practitioner (ARNP) and part‐time supervising physician to provide directed intervention and education for patients and medical personnel. Since August 2006, the ARNP has reviewed the out‐of‐range report daily, performs assessments, refines insulin orders, and educates clinicians. The assessments include chart review (of history and glycemic control), discussion with primary physician and nurse (and often the dietician), and interview of the patient and/or family. This leads to development and implementation of a glycemic control plan. Clinician education is performed both as direct education of the primary physician at the time of intervention and as didactic sessions.
Outcomes
Physician Insulin Ordering
The numbers of patients receiving basal and short‐acting insulin were identified from the electronic medication record. Basal insulin included glargine and neutral protamine Hagerdorn (NPH). Short‐acting insulin (lispro or regular) could be ordered as scheduled prandial, prandial correction, or sliding scale. The distinction between prandial correction and sliding scale is that correction precedes meals exclusively and is not intended for use without food; in contrast, sliding scale is given regardless of food being consumed and is considered substandard. Quality insulin ordering is defined as having basal, prandial scheduled, and prandial correction doses.
In the electronic record, however, we were unable to distinguish the intent of short‐acting insulin orders in the larger data set. Thus, we reviewed a subset of 100 randomly selected charts (25 from each year from 2003 through 2006) to differentiate scheduled prandial, prandial correction, and sliding scale.
Hyperglycemia
Hyperglycemia was defined as glucose 180 mg/dL. The proportion of dysglycemic patients with hyperglycemia was calculated daily as the percent of dysglycemic patients with any 2 glucose levels 180 mg/dL. Daily values were averaged for quarterly measures.
Hypoglycemia
Hypoglycemia was defined as glucose <60 mg/dL. The proportion of all dysglycemic patients with hypoglycemia was calculated daily as the percent of dysglycemic patients with a single glucose level of <60 mg/dL. Daily values were averaged for quarterly measures.
Data Collection
Data were retrieved from electronic medical records, hospital administrative decision support, and risk‐adjusted5 UHC clinical database information. Glucose data were obtained from laboratory records (venous) and nursing data from bedside chemsticks (capillary).
Statistical Analyses
Data were analyzed using SAS 9.1 (SAS Institute, Cary, NC) and SPSS 13.0 (SPSS, Chicago, IL). The mean and standard deviation (SD) for continuous variables and proportions for categorical variables were calculated. Data were examined, plotted, and trended over time. Where applicable, linear regression trend lines were fitted and tested for statistical significance (P value <0.05).
Results
Patients
In total, 44,225 patients were identified from January 1, 2003 through December 31, 2006; 18,087 patients (41%) were classified as dysglycemic as defined by either: (1) receiving insulin or oral diabetic medicine; or (2) having a glucose level 125 mg/dL or <60 mg/dL. Characteristics of the population are outlined in Table 1. Both groups shared similar ethnic distributions. Across all 4 years, dysglycemic patients tended to be older and have a higher severity of illness. As an additional descriptor of severity of illness, UHC mean expected length of stay (LOS) and mean expected mortality (risk‐adjusted5) were higher for dysglycemic patients.
| Dysglycemic | Euglycemic | |
|---|---|---|
| ||
| Number of patients | 18,088 | 26,144 |
| Age (years, mean SD) | 48.4 20.3 | 41.3 18.3 |
| Gender, male (%) | 64.7 | 62.7 |
| Ethnicity (%) | ||
| Caucasian | 68.2 | 70.1 |
| African‐American/Black | 11.0 | 12.0 |
| Hispanic | 6.8 | 6.2 |
| Native American | 1.8 | 18 |
| Asian | 7.9 | 5.5 |
| Unknown | 4.3 | 4.4 |
| UHC severity of illness index (%) | ||
| Minor | 18.3 | 38.8 |
| Moderate | 35.4 | 40.8 |
| Major | 29.5 | 16.7 |
| Extreme | 16.9 | 3.6 |
| UHC expected LOS (days, mean SD)* | 7.8 6.9 | 5.2 4.1 |
| UHC expected mortality (mean SD)* | 0.06 0.13 | 0.01 0.06 |
Physician Insulin Ordering
Ordering of both short‐acting and basal insulin increased (Figure 3). The ratio of short‐acting to basal orders decreased from 3.36 (1668/496) in 2003 to 1.97 (2226/1128) in 2006.
Chart review of the 100 randomly selected dysglycemic patients revealed increased ordering of prandial correction dosing from 8% of patients in 2003 to 32% in 2006. Yet, only 1 patient in 2003 and only 2 in 2006 had scheduled prandial. Ordering of sliding scale insulin fell from 16% in 2003 to 4% in 2006.
Glycemic Control Outcomes
The percentage of dysglycemic patients with hyperglycemia ranged from 19 to 24 without significant decline over the 4 years (Figure 4A). The percentage of hypoglycemic dysglycemic patients was increasing from 2003 to 2004, but in the years following the interventions (2005 through 2006) this declined significantly (P = 0.003; Figure 4B). On average, the observed LOS was higher for dysglycemic vs. euglycemic patients (mean SD days: 9.4 12.2 and 5.8 8.5, respectively). The mean observed to expected mortality ratio was 0.45 0.08 and 0.44 0.17 for the dysglycemic and euglycemic patients, respectively. Over the 4 years no statistically significant change in observed LOS or adjusted mortality was found (data not shown).
Conclusions
HMC, a safety net hospital with the highest UHC expected mortality of 131 hospitals nationwide, has demonstrated early successes in building its Glycemic Control Program, including: (1) decreased prescription of sliding scale; (2) a marked increase in prescription of basal insulin; and (3) significantly decreasing hypoglycemic events subsequent to the interventions. The decreased sliding scale and increased overall ordering of insulin could reflect increased awareness brought internationally through the literature and locally through our program. Two distinctive aspects of HMC's Glycemic Control Program, when compared to others,68 include: (1) the daily use of real‐time data to identify and target patients with out‐of‐range glucose levels; and (2) the coverage of all non‐critical‐care floors with a single clinician.
In 2003 and 2004, the increasing hypoglycemia we observed paralleled the international focus on aggressively treating hyperglycemia in the acute care setting. We observed a significant decrease in hypoglycemia in 2005 and 2006 that could be attributed to the education provided by the Glycemic Control Program and 2 features on the subcutaneous insulin order set: the prominent hypoglycemia protocol and the order hold prandial insulin if the patient cannot eat. These are similar features identified in a report on preventing hospital hypoglycemia.9 Additionally, hypoglycemia may have decreased secondary to the emphasis on not using short‐acting insulin at bedtime.
Despite increased and improved insulin ordering, we did not observe a significant change in the percent of dysglycemic patients with 2 glucose levels 180 mg/dL. In our program patients are identified for intervention after their glucose levels are out‐of‐range. To better evaluate the impact of our interventions on the glycemic control of each patient, we plan to analyze the glucose levels in the days following identification of patients. Alternatively, we could provide intervention to all patients with dysglycemia rather than waiting for glucoses to be out‐of‐range. Though this approach would require greater resources than the single clinician we currently employ.
Our early experience highlights areas for future evaluation and intervention. First, the lack of scheduled prandial insulin and that less than one‐third of dysglycemic patients have basal insulin ordered underscore a continued need to target quality insulin ordering to include all componentsbasal, scheduled prandial, and prandial correction. Second, while the daily report is a good rudimentary identification tool for at‐risk patients, it offers limited information as to the impact of our clinical intervention. Thus, refined evaluative metrics need be developed to prospectively assess the course of glycemic control for patients.
We acknowledge the limitations of this study. First, our most involved interventionthe addition of the clinical intervention teamcame only 6 months before the end of the study period. Second, this is an observational retrospective analysis and cannot distinguish confounders, such as physician preferences and decisions, that not easily quantified or controlled for. Third, our definition of dysglycemic incorporated 41% of non‐critical‐care patients, possibly reflecting too broad a definition.
In summary, we have described an inpatient Glycemic Control Program that relies on real‐time data to identify patients in need of intervention. Early in our program we observed improved insulin ordering quality and decreased rates of hypoglycemia. Future steps include evaluating the impact of our clinical intervention team and further refining glycemic control metrics to prospectively identify patients at risk for hyper‐ and hypoglycemia.
Acknowledgements
The authors thank Sofia Medvedev (UHC) and Derk B. Adams (HMC QI). The information contained in this article was based in part on the Clinical Data Products Data Base maintained by the UHC.
- ,,, et al.American College of Endocrinology position statement on inpatient diabetes and metabolic control.Endocr Pract.2004;10(suppl 2):4–9.
- ,,, et al.Management of diabetes and hyperglycemia in hospitals.Diabetes Care.2004;27:553–591.
- American College of Endocrinology and American Diabetes Association Consensus statement on inpatient diabetes and glycemic control.Diabetes Care.2006;29:1955–1962.
- University HealthSystem Consortium Mortality. Confidential Clinical Outcomes Report. Available at: http://www.uhc.edu. Accessed August2009 (Access with UHC permission only).
- Mortality risk adjustment for University HealthSystem Consortium's Clinical database. Available at: http://www.ahrq.gov/qual/mortality/Meurer.pdf. Accessed August2009.
- ,,, et al.Inpatient management of hyperglycemia: the Northwestern experience.Endocr Pract.2006;12:491–505.
- ,,,,.Evolution of a diabetes inpatient safety committee.Endocr Pract.2006;12(suppl 3):91–99.
- ,.Financial implications of glycemic control: results of an inpatient diabetes management program.Endocr Pract.2006;12(suppl 3):43–48.
- ,,, et al.Hospital hypoglycemia: not only treatment but also prevention.Endocr Pract.2004;10(suppl 2):89–99.