User login
Anjala Tess, MD, a hospitalist at Beth Israel Deaconess Medical Center and assistant professor of medicine at Harvard Medical School, Boston, asked the audience how many of them had done a quality improvement project that had failed. It was not a time to be bashful: Almost half the hospitalists in the room admitted that it had happened to them.
Dr. Tess and Darlene Tad-y, MD, chair of the Physicians-in-Training Committee and an assistant professor of medicine at the University of Colorado, were there to offer help in their session, “Adding to Your QI Toolbox.”
They highlighted three tools that they say are crucial to a project’s success: Creating a process map for clearly outlining how the project will work, interacting with stakeholders productively, and displaying data in a meaningful way.
Process mapping is a way of visualizing work or a process as distinct, ordered, and related steps, Dr. Tess said. Arranged on Post-It notes or written on a white board, the process should be one that can easily be updated. Seen objectively as a set of steps, it helps remove bias in how a process is viewed, she said.
“I would encourage you to do this on every QI project that you do where you are trying to accomplish something, because it makes a huge difference in understanding the work,” she said.
Stakeholder analysis – understanding the key people whose support could determine the success of the project – is also critical, she said. This can help get buy-in for the change, and it make a project stronger – and without it, you could doom your project, Dr. Tess said.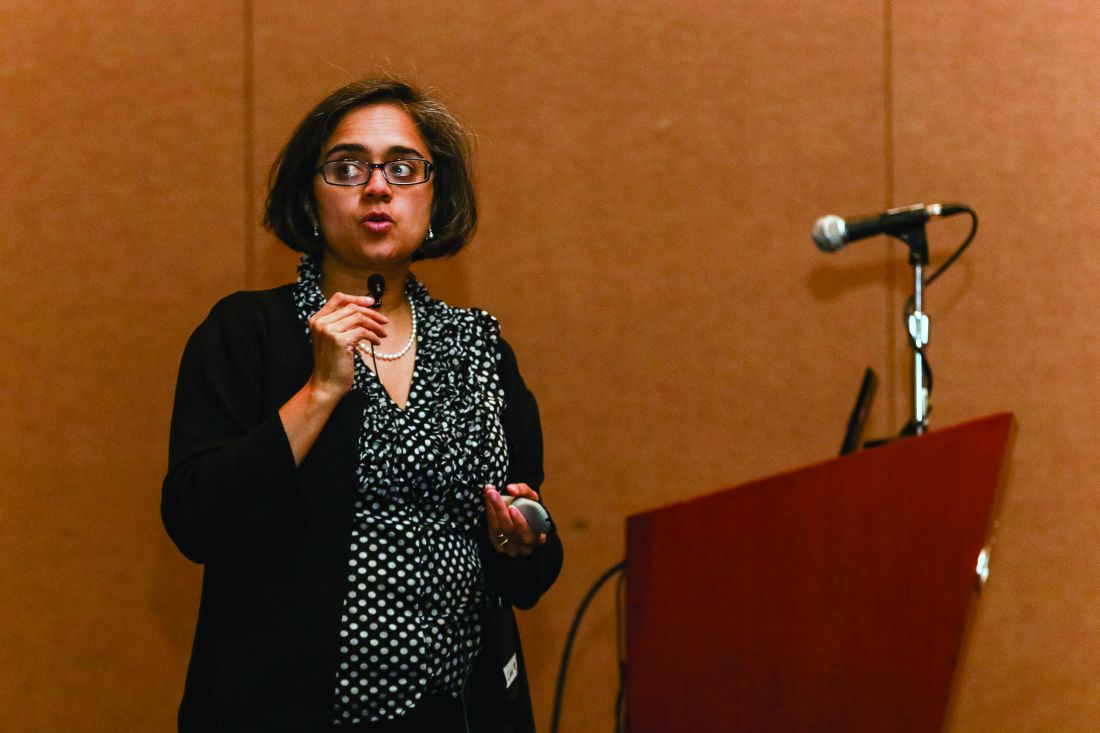
Doing this well involves understanding their financial and emotional interests, all the way down to whether they prefer face-to-face communication or e-mail, she said.
Then there’s the data. For it to matter, it must be presented well, and that requires context, Dr. Tad-y said.
“Data are just raw facts and figures,” she said. “Data are not the same as information.”
She suggested using run charts, in which data are plotted in some kind of order, usually chronological order. This kind of chart will typically include a median line, showing practice patterns before the QI project began, as well as a “goal line” to aim for, and notations on the timeline when changes were made, she said.
Others will be looking to the project manager for the meaning behind the data, she said.
“The story is going to come from you,” she said. “Otherwise, it’s just numbers.”