User login
High hospital occupancy is a fundamental challenge faced by healthcare systems in the United States.1-3 However, few studies have examined the effect of high occupancy on outcomes in the inpatient setting,4-9 and these showed mixed results. Hospital-acquired conditions (HACs), such as Clostridium difficile infection (CDI), are quality indicators for inpatient care and part of the Centers for Medicare and Medicaid Services’ Hospital-Acquired Conditions Reductions Program.10-12 However, few studies—largely conducted outside of the US—have evaluated the association between inpatient occupancy and HACs. These studies showed increasing hospital-acquired infection rates with increasing occupancy.13-15 Past studies of hospital occupancy have relied on annual average licensed bed counts, which are not a reliable measure of available and staffed beds and do not account for variations in patient volume and bed supply.16 Using a novel measure of inpatient occupancy, we tested the hypothesis that increasing inpatient occupancy is associated with a greater likelihood of CDI.
METHODS
We performed a retrospective analysis of administrative data from non-federal, acute care hospitals in California during 2008–2012 using the Office of Statewide Health Planning and Development (OSHPD) Patient Discharge Data set, a complete census of all CA licensed general acute care hospital discharge records. This study was approved by the OSHPD Committee for the Protection of Human Subjects and was deemed exempt by our institution’s Institutional Review Board.
Selection of Participants
The study population consisted of fee-for-service Medicare enrollees ≥65 years admitted through the emergency department (ED) with a hospital length of stay (HLOS) <50 days and a primary discharge diagnosis of acute myocardial infarction (MI), pneumonia (PNA), or heart failure (HF; [identified through the respective Clinical Classification Software [CCS]).
The sample was restricted to discharges with a HLOS of <50 days, because those with longer HLOS (0.01% of study sample) were likely different in ways that may bias our findings (eg, they will likely be sicker). We limited our study to admissions through the ED to reduce potential selection bias by excluding elective admissions and hospital-to-hospital transfers, which are likely dependent on occupancy. MI, HF, and PNA diagnoses were selected because they are prevalent and have high inpatient mortality, allowing us to examine the effect of occupancy on some of the sickest inpatients.17
Hospital-acquired cases of CDI were identified as discharges (using ICD-9 code 008.45 for CDI) that were not marked as present-on-admission (POA) using the method described by Zhan et al.18 To avoid small facility outlying effects, we included hospitals that had 100 or more MI, HF, and PNA discharges that met the inclusion criteria over the study years.
OSHPD inpatient data were combined with OSHPD hospital annual financial data that contain hospital-level variables including ownership (City/County, District, Investor, and Non-Profit), geography (based on health services area), teaching status, urbanicity, and size based on the number of average annual licensed beds. If characteristics were not available for a given hospital for 1 or more years, the information from the closest available year was used for that hospital (replacement required for 10,504 (1.5%) cases; 4,856 otherwise eligible cases (0.7%) were dropped because the hospital was not included in the annual financial data for any year. Approximately 0.2% of records had invalid values for disposition, payer, or admission route, and were therefore dropped. Patient residence zip code-level socioeconomic status was measured using the percentage of families living below the poverty line, median family income, and the percentage of individuals with less than a high school degree among those aged ≥ 25 years19; these measures were divided into 3 groups (bottom quartile, top quartile, and middle 50%) for analysis.
Measure of Occupancy
Calculating Daily Census and Bed Capacity
We calculated the daily census using admission date and HLOS for each observation in our dataset. We approximated the bed capacity as the maximum daily census in the 121-day window (+/- 60 days) around each census day in each hospital. The 121-day window was chosen to increase the likelihood of capturing changes in bed availability (eg, due to unit closures) and seasonal variability. Our daily census does not include patients admitted with psychiatric and obstetrics diagnoses and long-term care/rehabilitation stays (identified through CCS categories and excluded) because these patients are not likely to compete for the same hospital resources as those receiving care for MI, HF, and PNA. See Appendix Table 1 for definition of the occupancy terms.
Calculating Relative Daily Occupancy
We developed a raw hospital-specific occupancy measure by dividing the daily census by the maximum census in each 121-day window for each hospital. We converted these raw measures to percentiles within the 121-day window to create a daily relative occupancy measure. For example, median level occupancy day would correspond to an occupancy of 0.5; a minimum or maximum occupancy day would correspond to 0 or 1, respectively. We preferred a relative occupancy measure because it assumes that what constitutes “high occupancy” likely depends on the usual occupancy level of the facility.
Measuring Admission Day Occupancy and Average Occupancy over Hospitalization
Using the relative daily occupancy values, we constructed patient-level variables representing occupancy on admission day and average occupancy during hospitalization.
Data Analysis
First, we estimated descriptive statistics of the sample for occupancy, patient-level (eg, age, race, gender, and severity of illness), hospital-level (eg, size, teaching status, and urbanicity), and incident-level (day-of-the-week and season) variables. Next, we used logistic regression with cluster standard errors to estimate the adjusted and unadjusted association of occupancy with CDI. For this analysis, occupancy was broken into 4 groups: 0.00-0.25 (low occupancy); 0.26-0.50; 0.51-0.75; and 0.76-1.00 (high occupancy), with the 0.0-0.25 group treated as the reference level. We fit separate models for admission and average occupancy and re-ran the latter model including HLOS as a sensitivity analysis.
RESULTS
Study Population and Hospitals
Across 327 hospitals, 558,829 discharges (including deaths) met our inclusion criteria and there were 2045 admissions with CDI. The hospital and discharge characteristics are reported in Appendix Table 2.
Relationship of Occupancy with CDI
With regard to admission occupancy, the 0.26-0.50 group did not have a significantly higher rate of CDI than the low occupancy group. Both the 0.51-0.75 and the 0.76-1.00 occupancy groups had 15% lower odds of CDI compared to the low occupancy group (Table). The adjusted results were similar, although the comparison between the low and high occupancy groups was marginally nonsignificant.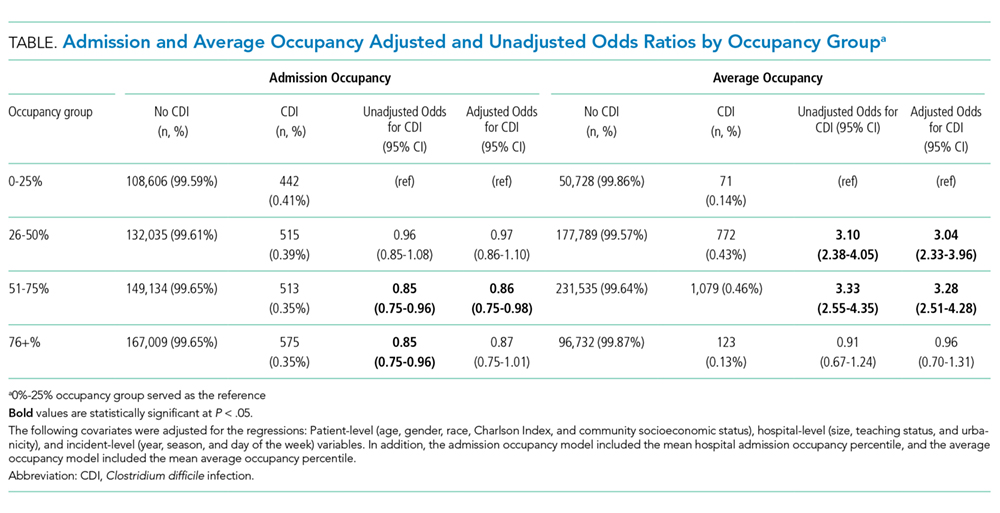
With regard to average occupancy, intermediate levels of occupancy (ie, 0.26-0.50 and 0.51-0.75 groups) had over 3-fold increased odds of CDI relative to the low occupancy group; the high occupancy group did not have significantly different odds of CDI compared to the low occupancy group (Table 1). The adjusted results were similar with no changes in statistical significance. Including HLOS tempered the adjusted odds of CDI to 1.6 for intermediate levels of occupancy, but these remained significantly higher than high or low occupancy.
DISCUSSION
Hospital occupancy is related to CDI. However, contrary to expectation, we found that higher admission and average occupancy over hospitalization were not related to more hospital-acquired CDI. CDI rates were highest for intermediate levels of average occupancy with lower CDI rates at high and low occupancy. CDI had an inverse relationship with admission occupancy.
These findings suggest that an exploration of the processes associated with hospitals accommodating higher occupancy might elucidate measures to reduce CDI. How do staffing, implementation of policies, and routine procedures vary when hospitals are busy or quiet? What aspects of care delivery that function well during high and low occupancy periods breakdown during intermediate occupancy? Hospital policies, practices, and procedures during different phases of occupancy might inform best practices. These data suggest that hospital occupancy level should be a routinely collected data element by infection control officers and that this should be linked with protocols triggered or modified with high or low occupancy that might affect HACs.
Previous studies in Europe found increasing hospital-acquired infection rates with increasing occupancy.13-15 The authors postulated that increasing occupancy may limit available resources and increase nursing workloads, negatively impacting adherence to hand hygiene and cleaning protocols .8 However, these studies did not account for infections that were POA. In addition, our study examined hospitals in California after the 2006 implementation of the minimum nurse staffing policy, which means that staff to patient ratios could not fall below fixed thresholds that were typically higher than pre-policy ratios.19
This study had limitations pertaining to coded administrative data, including quality of coding and data validity. However, OSHPD has strict data reporting processes.20 This study focused on 1 state; however, California is large with a demographically diverse population and hospital types, characteristics that would help generalize findings. Furthermore, when using the average occupancy measure, we could not determine whether the complication was acquired during the high occupancy period of the hospitalization.
Higher admission day occupancy was associated with lower likelihood of CDI, and CDI rates were lower at high and low average occupancy. These findings should prompt exploration of how hospitals react to occupancy changes and how those care processes translate into HACs in order to inform best practices for hospital care.
Acknowledgments
The authors would like to thank Ms. Amanda Kogowski, MPH and Mr. Rekar Taymour, MS for their editorial assistance with drafting the manuscript.
Disclosures
The authors have no conflicts to disclose.
Funding
This study was funded by the National Institute on Aging.
1. Siegel B, Wilson MJ, Sickler D. Enhancing work flow to reduce crowding. Jt Comm J Qual Patient Saf. 2007;33(11):57-67. PubMed
2. Institute of Medicine Committee on the Future of Emergency Care in the U. S. Health System. The future of emergency care in the United States health system. Ann Emerg Med. 2006;48(2):115-120. DOI:10.1016/j.annemergmed.2006.06.015. PubMed
3. Weissman JS, Rothschild JM, Bendavid E, et al. Hospital workload and adverse events. Med Care. 2007;45(5):448-455. DOI: 10.1097/01.mlr.0000257231.86368.09. PubMed
4. Fieldston ES, Hall M, Shah SS, et al. Addressing inpatient crowding by smoothing occupancy at children’s hospitals. JHM. 2011;6(8):466-473. DOI: 10.1186/s12245-014-0025-4. PubMed
5. Evans WN, Kim B. Patient outcomes when hospitals experience a surge in admissions. J Health Econ. 2006;25(2):365-388. DOI: 10.1016/j.jhealeco.2005.10.003. PubMed
6. Bair AE, Song WT, Chen Y-C, Morris BA. The impact of inpatient boarding on ED efficiency: a discrete-event simulation study. J Med Syst. 2010;34(5):919-929. DOI: 10.1007/s10916-009-9307-4. PubMed
7. Schilling PL, Campbell Jr DA, Englesbe MJ, Davis MM. A comparison of in-hospital mortality risk conferred by high hospital occupancy, differences in nurse staffing levels, weekend admission, and seasonal influenza. Med Care. 2010;48(3):224-232. DOI: 10.1097/MLR.0b013e3181c162c0. PubMed
8. Schwierz C, Augurzky B, Focke A, Wasem J. Demand, selection and patient outcomes in German acute care hospitals. Health Econ. 2012;21(3):209-221. PubMed
9. Sharma R, Stano M, Gehring R. Short‐term fluctuations in hospital demand: implications for admission, discharge, and discriminatory behavior. RAND J. Econ. 2008;39(2):586-606. PubMed
10. Centers for Medicare and Medicaid Services. Hospital-Acquired Condition Reduction Program (HACRP). 2016; https://www.cms.gov/Medicare/Medicare-Fee-for-Service-Payment/AcuteInpatientPPS/HAC-Reduction-Program.html. Accessed October 05, 2017.
11. Cunningham JB, Kernohan G, Rush T. Bed occupancy, turnover intervals and MRSA rates in English hospitals. Br J Nurs. 2006;15(12):656-660. DOI: 10.12968/bjon.2006.15.12.21398. PubMed
12. Cunningham JB, Kernohan WG, Rush T. Bed occupancy, turnover interval and MRSA rates in Northern Ireland. Br J Nurs. 2006;15(6):324-328. DOI: 10.12968/bjon.2006.15.6.20680. PubMed
13. Kaier K, Luft D, Dettenkofer M, Kist M, Frank U. Correlations between bed occupancy rates and Clostridium difficile infections: a time-series analysis. Epidemiol Infect. 2011;139(3):482-485. DOI: 10.1017/S0950268810001214. PubMed
14. Rafferty AM, Clarke SP, Coles J, et al. Outcomes of variation in hospital nurse staffing in English hospitals: cross-sectional analysis of survey data and discharge records. Int J Nurs Stud. 2007;44(2):175-182. DOI: 10.1016/j.ijnurstu.2006.08.003. PubMed
15. Bell CM, Redelmeier DA. Mortality among patients admitted to hospitals on weekends as compared with weekdays. N Engl J Med. 2001;345(9):663-668. DOI: 10.1056/NEJMsa003376. PubMed
16. Zhan C, Elixhauser A, Richards CL Jr, et al. Identification of hospital-acquired catheter-associated urinary tract infections from Medicare claims: sensitivity and positive predictive value. Med Care. 2009;47(3):364-369. DOI: 10.1097/MLR.0b013e31818af83d. PubMed
17. U.S. American factfinder. United States Census Bureau; 2016.
18. McHugh MD, Ma C. Hospital nursing and 30-day readmissions among Medicare patients with heart failure, acute myocardial infarction, and pneumonia. Med Care. 2013;51(1):52. DOI: 10.1097/MLR.0b013e3182763284. PubMed
19. Coffman JM, Seago JA, Spetz J. Minimum nurse-to-patient ratios in acute care hospitals in California. Health Aff. 2002;21(5):53-64. DOI:10.1377/hlthaff.21.5.53 PubMed
20. State of California. Medical Information Reporting for California (MIRCal) Regulations. 2016.
High hospital occupancy is a fundamental challenge faced by healthcare systems in the United States.1-3 However, few studies have examined the effect of high occupancy on outcomes in the inpatient setting,4-9 and these showed mixed results. Hospital-acquired conditions (HACs), such as Clostridium difficile infection (CDI), are quality indicators for inpatient care and part of the Centers for Medicare and Medicaid Services’ Hospital-Acquired Conditions Reductions Program.10-12 However, few studies—largely conducted outside of the US—have evaluated the association between inpatient occupancy and HACs. These studies showed increasing hospital-acquired infection rates with increasing occupancy.13-15 Past studies of hospital occupancy have relied on annual average licensed bed counts, which are not a reliable measure of available and staffed beds and do not account for variations in patient volume and bed supply.16 Using a novel measure of inpatient occupancy, we tested the hypothesis that increasing inpatient occupancy is associated with a greater likelihood of CDI.
METHODS
We performed a retrospective analysis of administrative data from non-federal, acute care hospitals in California during 2008–2012 using the Office of Statewide Health Planning and Development (OSHPD) Patient Discharge Data set, a complete census of all CA licensed general acute care hospital discharge records. This study was approved by the OSHPD Committee for the Protection of Human Subjects and was deemed exempt by our institution’s Institutional Review Board.
Selection of Participants
The study population consisted of fee-for-service Medicare enrollees ≥65 years admitted through the emergency department (ED) with a hospital length of stay (HLOS) <50 days and a primary discharge diagnosis of acute myocardial infarction (MI), pneumonia (PNA), or heart failure (HF; [identified through the respective Clinical Classification Software [CCS]).
The sample was restricted to discharges with a HLOS of <50 days, because those with longer HLOS (0.01% of study sample) were likely different in ways that may bias our findings (eg, they will likely be sicker). We limited our study to admissions through the ED to reduce potential selection bias by excluding elective admissions and hospital-to-hospital transfers, which are likely dependent on occupancy. MI, HF, and PNA diagnoses were selected because they are prevalent and have high inpatient mortality, allowing us to examine the effect of occupancy on some of the sickest inpatients.17
Hospital-acquired cases of CDI were identified as discharges (using ICD-9 code 008.45 for CDI) that were not marked as present-on-admission (POA) using the method described by Zhan et al.18 To avoid small facility outlying effects, we included hospitals that had 100 or more MI, HF, and PNA discharges that met the inclusion criteria over the study years.
OSHPD inpatient data were combined with OSHPD hospital annual financial data that contain hospital-level variables including ownership (City/County, District, Investor, and Non-Profit), geography (based on health services area), teaching status, urbanicity, and size based on the number of average annual licensed beds. If characteristics were not available for a given hospital for 1 or more years, the information from the closest available year was used for that hospital (replacement required for 10,504 (1.5%) cases; 4,856 otherwise eligible cases (0.7%) were dropped because the hospital was not included in the annual financial data for any year. Approximately 0.2% of records had invalid values for disposition, payer, or admission route, and were therefore dropped. Patient residence zip code-level socioeconomic status was measured using the percentage of families living below the poverty line, median family income, and the percentage of individuals with less than a high school degree among those aged ≥ 25 years19; these measures were divided into 3 groups (bottom quartile, top quartile, and middle 50%) for analysis.
Measure of Occupancy
Calculating Daily Census and Bed Capacity
We calculated the daily census using admission date and HLOS for each observation in our dataset. We approximated the bed capacity as the maximum daily census in the 121-day window (+/- 60 days) around each census day in each hospital. The 121-day window was chosen to increase the likelihood of capturing changes in bed availability (eg, due to unit closures) and seasonal variability. Our daily census does not include patients admitted with psychiatric and obstetrics diagnoses and long-term care/rehabilitation stays (identified through CCS categories and excluded) because these patients are not likely to compete for the same hospital resources as those receiving care for MI, HF, and PNA. See Appendix Table 1 for definition of the occupancy terms.
Calculating Relative Daily Occupancy
We developed a raw hospital-specific occupancy measure by dividing the daily census by the maximum census in each 121-day window for each hospital. We converted these raw measures to percentiles within the 121-day window to create a daily relative occupancy measure. For example, median level occupancy day would correspond to an occupancy of 0.5; a minimum or maximum occupancy day would correspond to 0 or 1, respectively. We preferred a relative occupancy measure because it assumes that what constitutes “high occupancy” likely depends on the usual occupancy level of the facility.
Measuring Admission Day Occupancy and Average Occupancy over Hospitalization
Using the relative daily occupancy values, we constructed patient-level variables representing occupancy on admission day and average occupancy during hospitalization.
Data Analysis
First, we estimated descriptive statistics of the sample for occupancy, patient-level (eg, age, race, gender, and severity of illness), hospital-level (eg, size, teaching status, and urbanicity), and incident-level (day-of-the-week and season) variables. Next, we used logistic regression with cluster standard errors to estimate the adjusted and unadjusted association of occupancy with CDI. For this analysis, occupancy was broken into 4 groups: 0.00-0.25 (low occupancy); 0.26-0.50; 0.51-0.75; and 0.76-1.00 (high occupancy), with the 0.0-0.25 group treated as the reference level. We fit separate models for admission and average occupancy and re-ran the latter model including HLOS as a sensitivity analysis.
RESULTS
Study Population and Hospitals
Across 327 hospitals, 558,829 discharges (including deaths) met our inclusion criteria and there were 2045 admissions with CDI. The hospital and discharge characteristics are reported in Appendix Table 2.
Relationship of Occupancy with CDI
With regard to admission occupancy, the 0.26-0.50 group did not have a significantly higher rate of CDI than the low occupancy group. Both the 0.51-0.75 and the 0.76-1.00 occupancy groups had 15% lower odds of CDI compared to the low occupancy group (Table). The adjusted results were similar, although the comparison between the low and high occupancy groups was marginally nonsignificant.
With regard to average occupancy, intermediate levels of occupancy (ie, 0.26-0.50 and 0.51-0.75 groups) had over 3-fold increased odds of CDI relative to the low occupancy group; the high occupancy group did not have significantly different odds of CDI compared to the low occupancy group (Table 1). The adjusted results were similar with no changes in statistical significance. Including HLOS tempered the adjusted odds of CDI to 1.6 for intermediate levels of occupancy, but these remained significantly higher than high or low occupancy.
DISCUSSION
Hospital occupancy is related to CDI. However, contrary to expectation, we found that higher admission and average occupancy over hospitalization were not related to more hospital-acquired CDI. CDI rates were highest for intermediate levels of average occupancy with lower CDI rates at high and low occupancy. CDI had an inverse relationship with admission occupancy.
These findings suggest that an exploration of the processes associated with hospitals accommodating higher occupancy might elucidate measures to reduce CDI. How do staffing, implementation of policies, and routine procedures vary when hospitals are busy or quiet? What aspects of care delivery that function well during high and low occupancy periods breakdown during intermediate occupancy? Hospital policies, practices, and procedures during different phases of occupancy might inform best practices. These data suggest that hospital occupancy level should be a routinely collected data element by infection control officers and that this should be linked with protocols triggered or modified with high or low occupancy that might affect HACs.
Previous studies in Europe found increasing hospital-acquired infection rates with increasing occupancy.13-15 The authors postulated that increasing occupancy may limit available resources and increase nursing workloads, negatively impacting adherence to hand hygiene and cleaning protocols .8 However, these studies did not account for infections that were POA. In addition, our study examined hospitals in California after the 2006 implementation of the minimum nurse staffing policy, which means that staff to patient ratios could not fall below fixed thresholds that were typically higher than pre-policy ratios.19
This study had limitations pertaining to coded administrative data, including quality of coding and data validity. However, OSHPD has strict data reporting processes.20 This study focused on 1 state; however, California is large with a demographically diverse population and hospital types, characteristics that would help generalize findings. Furthermore, when using the average occupancy measure, we could not determine whether the complication was acquired during the high occupancy period of the hospitalization.
Higher admission day occupancy was associated with lower likelihood of CDI, and CDI rates were lower at high and low average occupancy. These findings should prompt exploration of how hospitals react to occupancy changes and how those care processes translate into HACs in order to inform best practices for hospital care.
Acknowledgments
The authors would like to thank Ms. Amanda Kogowski, MPH and Mr. Rekar Taymour, MS for their editorial assistance with drafting the manuscript.
Disclosures
The authors have no conflicts to disclose.
Funding
This study was funded by the National Institute on Aging.
1. Siegel B, Wilson MJ, Sickler D. Enhancing work flow to reduce crowding. Jt Comm J Qual Patient Saf. 2007;33(11):57-67. PubMed
2. Institute of Medicine Committee on the Future of Emergency Care in the U. S. Health System. The future of emergency care in the United States health system. Ann Emerg Med. 2006;48(2):115-120. DOI:10.1016/j.annemergmed.2006.06.015. PubMed
3. Weissman JS, Rothschild JM, Bendavid E, et al. Hospital workload and adverse events. Med Care. 2007;45(5):448-455. DOI: 10.1097/01.mlr.0000257231.86368.09. PubMed
4. Fieldston ES, Hall M, Shah SS, et al. Addressing inpatient crowding by smoothing occupancy at children’s hospitals. JHM. 2011;6(8):466-473. DOI: 10.1186/s12245-014-0025-4. PubMed
5. Evans WN, Kim B. Patient outcomes when hospitals experience a surge in admissions. J Health Econ. 2006;25(2):365-388. DOI: 10.1016/j.jhealeco.2005.10.003. PubMed
6. Bair AE, Song WT, Chen Y-C, Morris BA. The impact of inpatient boarding on ED efficiency: a discrete-event simulation study. J Med Syst. 2010;34(5):919-929. DOI: 10.1007/s10916-009-9307-4. PubMed
7. Schilling PL, Campbell Jr DA, Englesbe MJ, Davis MM. A comparison of in-hospital mortality risk conferred by high hospital occupancy, differences in nurse staffing levels, weekend admission, and seasonal influenza. Med Care. 2010;48(3):224-232. DOI: 10.1097/MLR.0b013e3181c162c0. PubMed
8. Schwierz C, Augurzky B, Focke A, Wasem J. Demand, selection and patient outcomes in German acute care hospitals. Health Econ. 2012;21(3):209-221. PubMed
9. Sharma R, Stano M, Gehring R. Short‐term fluctuations in hospital demand: implications for admission, discharge, and discriminatory behavior. RAND J. Econ. 2008;39(2):586-606. PubMed
10. Centers for Medicare and Medicaid Services. Hospital-Acquired Condition Reduction Program (HACRP). 2016; https://www.cms.gov/Medicare/Medicare-Fee-for-Service-Payment/AcuteInpatientPPS/HAC-Reduction-Program.html. Accessed October 05, 2017.
11. Cunningham JB, Kernohan G, Rush T. Bed occupancy, turnover intervals and MRSA rates in English hospitals. Br J Nurs. 2006;15(12):656-660. DOI: 10.12968/bjon.2006.15.12.21398. PubMed
12. Cunningham JB, Kernohan WG, Rush T. Bed occupancy, turnover interval and MRSA rates in Northern Ireland. Br J Nurs. 2006;15(6):324-328. DOI: 10.12968/bjon.2006.15.6.20680. PubMed
13. Kaier K, Luft D, Dettenkofer M, Kist M, Frank U. Correlations between bed occupancy rates and Clostridium difficile infections: a time-series analysis. Epidemiol Infect. 2011;139(3):482-485. DOI: 10.1017/S0950268810001214. PubMed
14. Rafferty AM, Clarke SP, Coles J, et al. Outcomes of variation in hospital nurse staffing in English hospitals: cross-sectional analysis of survey data and discharge records. Int J Nurs Stud. 2007;44(2):175-182. DOI: 10.1016/j.ijnurstu.2006.08.003. PubMed
15. Bell CM, Redelmeier DA. Mortality among patients admitted to hospitals on weekends as compared with weekdays. N Engl J Med. 2001;345(9):663-668. DOI: 10.1056/NEJMsa003376. PubMed
16. Zhan C, Elixhauser A, Richards CL Jr, et al. Identification of hospital-acquired catheter-associated urinary tract infections from Medicare claims: sensitivity and positive predictive value. Med Care. 2009;47(3):364-369. DOI: 10.1097/MLR.0b013e31818af83d. PubMed
17. U.S. American factfinder. United States Census Bureau; 2016.
18. McHugh MD, Ma C. Hospital nursing and 30-day readmissions among Medicare patients with heart failure, acute myocardial infarction, and pneumonia. Med Care. 2013;51(1):52. DOI: 10.1097/MLR.0b013e3182763284. PubMed
19. Coffman JM, Seago JA, Spetz J. Minimum nurse-to-patient ratios in acute care hospitals in California. Health Aff. 2002;21(5):53-64. DOI:10.1377/hlthaff.21.5.53 PubMed
20. State of California. Medical Information Reporting for California (MIRCal) Regulations. 2016.
© 2018 Society of Hospital Medicine